
PUBLISHER: Mordor Intelligence | PRODUCT CODE: 1907296

PUBLISHER: Mordor Intelligence | PRODUCT CODE: 1907296
Hydroquinone - Market Share Analysis, Industry Trends & Statistics, Growth Forecasts (2026 - 2031)
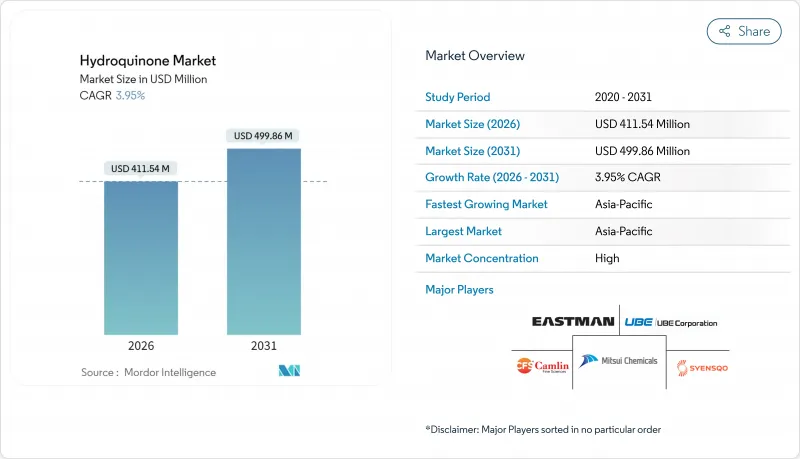
Hydroquinone market size in 2026 is estimated at USD 411.54 million, growing from 2025 value of USD 395.90 million with 2031 projections showing USD 499.86 million, growing at 3.95% CAGR over 2026-2031.
The expansion is anchored in polymerization inhibitor demand, which cushions overall growth against stricter rules in cosmetic uses. Industrial downstreams in styrene, acrylic, and vinyl monomers keep plant utilization healthy, while producers hedge regulatory risk by offering pharmaceutical-grade and green-route grades. Asia-Pacific plants leverage integrated phenol-acetone chains and competitively priced feedstock; this regional cost edge allows local suppliers to serve both domestic converters and overseas buyers. North American and European makers defend their share through USP-compliant specialties and process know-how. Adoption of hydrogen-peroxide hydroxylation routes, together with incremental catalyst advances, signals a gradual technology pivot toward lower-emission production.
Global Hydroquinone Market Trends and Insights
Shift to USP-grade HQ for Regulated OTC Dermatology
Dermatology clinics steadily replace cosmetic-grade material with USP-grade hydroquinone to comply with U.S. FDA and European Pharmacopoeia standards. Eastman Chemical runs cGMP lines dedicated to this specification, supplying finished-dose formulators with fully traceable documentation. Prescribers appreciate batch consistency that supports combination therapies using glycolic acid or tretinoin, driving per-patient volume. Higher regulatory barriers deter low-cost entrants, letting qualified suppliers command price premiums while reducing litigation risk for healthcare providers. The resulting demand uplift is strongest in North America and advanced Asian markets, providing a margin-rich pocket for the hydroquinone market.
Rising Demand for Non-phenolic Antioxidants in Food Packaging
Food brands seeking longer shelf life at elevated processing temperatures increasingly favor tert-butylhydroquinone (TBHQ) and related derivatives. Integrated producers such as Camlin Fine Sciences manufacture both hydroquinone feedstock and downstream TBHQ at Indian and European sites, giving converters a single-source supply chain. Regulatory approvals in the U.S., EU, and Japan ease cross-border adoption, while consumer preference for cleaner labels fuels interest in dosage-efficient additives that minimize overall formulation load. Since TBHQ starts from hydroquinone, healthy derivative demand indirectly sustains base-grade consumption, fortifying the hydroquinone market against cyclicality in other end uses.
Carcinogenicity Concerns Driving Regulatory Bans
The European Chemicals Agency restricts hydroquinone in leave-on cosmetics, a stance echoed by regulators in Indonesia and other emerging markets. Product recalls linked to non-compliant whitening lotions erode consumer trust and accelerate formulator migration to arbutin or kojic acid. Small cosmetic producers struggle with the cost of reformulation and testing, trimming demand from an already contracting segment. While industrial uses remain untouched, negative public perception spills into adjacent categories, forcing distributors to maintain higher compliance documentation and insurance coverage.
Other drivers and restraints analyzed in the detailed report include:
- Capacity Additions in Asia for Polymerization Inhibitors
- Growing Preference for Green H2O2 Hydroxylation Routes
- Price Volatility of Cumene Feedstock
For complete list of drivers and restraints, kindly check the Table Of Contents.
Segment Analysis
Hydroquinone's unrivaled effectiveness in quenching radical polymerization gave polymerization inhibitors 66.58% of 2025 revenue. The segment's 4.28% CAGR to 2031 keeps it as both largest and fastest within the hydroquinone market. Resin plants dose 10-200 ppm during styrene, acrylate, and vinyl monomer storage, preventing runaway reactions that otherwise trigger off-spec batches or safety hazards. Geographic production shifts toward Asia-Pacific amplify demand as new monomer complexes come online. Antioxidant and photographic applications remain niche; however, renewed interest in specialty analog film and high-performance polymers preserves a profitable tail. Process innovators are now devising controlled-release inhibitor sachets that minimize operator exposure and reduce line fouling, raising the service component of future revenues.
The concentration in polymerization inhibitors also embeds cyclic exposure: monomer capacity additions boost sales, whereas resin production slowdowns can materially dent shipments. Still, the breadth of monomer types and the critical safety role insulate the hydroquinone market from complete collapse in downturns. Emerging cosmetic uses involving activated-carbon-supported hydroquinone catalysts warrant monitoring, yet their early-stage scale keeps them outside core forecasts. Industrial buyers increasingly demand dual-certified grades meeting both polymer and food-contact standards to streamline vendor lists, a shift that favors vertically integrated producers.
The Hydroquinone Market Report is Segmented by Application (Intermediate, Antioxidant, Polymerization Inhibitor, and Photosensitive Chemical), Production Process (Cumene Hydroperoxide Route, H2O2 Hydroxylation of Phenol, and Aniline Oxidation), End-Use Industry (Cosmetics, Polymers, Paints and Adhesives, and More), and Geography (Asia-Pacific, North America, and More). The Market Forecasts are Provided in Terms of Value (USD).
Geography Analysis
Asia-Pacific owned 47.82% of 2025 revenue and will expand at a 4.31% CAGR to 2031, underpinning its primacy in the hydroquinone market. China's fully integrated phenol-acetone complexes ensure competitively priced feedstock, while India's specialty chemical champions, led by Camlin Fine Sciences, add globe-serving volumes through the Dahej 15,000 tons per year unit.
North America balances higher production costs with robust demand from pharmaceutical and high-end industrial niches. Eastman Chemical exploits vertical integration and FDA-registered facilities to deliver USP-grade and specialty photographic grades worldwide.
Europe continues to wrestle with rising energy costs and evolving REACH regulations that restrict cosmetic use but leave industrial volumes intact. Producers invest in process upgrades to curtail emissions and win corporate procurement points tied to ESG metrics. Partnerships like Mitsui Chemicals' and Mitsubishi Chemical's phenol-supply study illustrate regional efforts to de-risk feedstock exposure and optimize asset footprints.
Smaller regions, South America, the Middle East, and Africa, register nascent growth as new petrochemical parks come online, yet they still depend heavily on imports for specialized grades, positioning Asia-Pacific exporters to reinforce volume flows.
- Brother Technology
- Camlin Fine Sciences Ltd.
- Eastman Chemical Company
- FUJIFILM Wako Pure Chemical Corporation
- Haihang Industry
- Hubei Kaiyuan Chemicals & Technology Co., Ltd.
- Jiangsu Sanjili Chemical Co., LTD
- Mitsui Chemicals, Inc.
- Syensqo
- TIANJIN ZHONGXIN CHEMTECH CO.,LTD.(ZX CHEMTECH)
- UBE Corporation
- Yancheng Fengyang Chemical Co., Ltd.
Additional Benefits:
- The market estimate (ME) sheet in Excel format
- 3 months of analyst support
TABLE OF CONTENTS
1 Introduction
- 1.1 Study Assumptions and Market Definition
- 1.2 Scope of the Study
2 Research Methodology
3 Executive Summary
4 Market Landscape
- 4.1 Market Overview
- 4.2 Market Drivers
- 4.2.1 Shift to USP-grade HQ for regulated OTC dermatology
- 4.2.2 Rising demand for non-phenolic antioxidants in food packaging
- 4.2.3 Capacity additions in Asia for polymerization inhibitors
- 4.2.4 Growing preference for green H2O2 hydroxylation routes
- 4.2.5 Photographic grade revival from analog film niche
- 4.3 Market Restraints
- 4.3.1 Carcinogenicity concerns driving regulatory bans
- 4.3.2 ECHA REACH restrictions on leave-on cosmetics
- 4.3.3 Price volatility of cumene feedstock
- 4.4 Value Chain Analysis
- 4.5 Porter's Five Forces Analysis
- 4.5.1 Bargaining Power of Suppliers
- 4.5.2 Bargaining Power of Buyers
- 4.5.3 Threat of New Entrants
- 4.5.4 Threat of Substitutes
- 4.5.5 Degree of Competition
5 Market Size and Growth Forecasts (Value)
- 5.1 By Application
- 5.1.1 Intermediate
- 5.1.2 Antioxidant
- 5.1.3 Polymerization Inhibitor
- 5.1.4 Photosensitive Chemical
- 5.2 By Production Process
- 5.2.1 Cumene Hydroperoxide Route
- 5.2.2 H2O2 Hydroxylation of Phenol
- 5.2.3 Aniline Oxidation
- 5.3 By End-use Industry
- 5.3.1 Cosmetics
- 5.3.2 Polymers
- 5.3.3 Paints and Adhesives
- 5.3.4 Rubber
- 5.3.5 Others
- 5.4 By Geography
- 5.4.1 Asia-Pacific
- 5.4.1.1 China
- 5.4.1.2 India
- 5.4.1.3 Japan
- 5.4.1.4 South Korea
- 5.4.1.5 Malaysia
- 5.4.1.6 Thailand
- 5.4.1.7 Indonesia
- 5.4.1.8 Vietnam
- 5.4.1.9 Rest of Asia-Pacific
- 5.4.2 North America
- 5.4.2.1 United States
- 5.4.2.2 Canada
- 5.4.2.3 Mexico
- 5.4.3 Europe
- 5.4.3.1 Germany
- 5.4.3.2 United Kingdom
- 5.4.3.3 Italy
- 5.4.3.4 France
- 5.4.3.5 Russia
- 5.4.3.6 Spain
- 5.4.3.7 Turkey
- 5.4.3.8 Nordic Countries
- 5.4.3.9 Rest of Europe
- 5.4.4 South America
- 5.4.4.1 Brazil
- 5.4.4.2 Argentina
- 5.4.4.3 Colombia
- 5.4.4.4 Rest of South America
- 5.4.5 Middle-East and Africa
- 5.4.5.1 Saudi Arabia
- 5.4.5.2 United Arab Emirates
- 5.4.5.3 Qatar
- 5.4.5.4 Egypt
- 5.4.5.5 Nigeria
- 5.4.5.6 South Africa
- 5.4.5.7 Rest of Middle-East and Africa
- 5.4.1 Asia-Pacific
6 Competitive Landscape
- 6.1 Market Concentration
- 6.2 Strategic Moves
- 6.3 Market Share (%)/Ranking Analysis
- 6.4 Company Profiles (includes Global level Overview, Market level overview, Core Segments, Financials as available, Strategic Information, Market Rank/Share for key companies, Products and Services, and Recent Developments)
- 6.4.1 Brother Technology
- 6.4.2 Camlin Fine Sciences Ltd.
- 6.4.3 Eastman Chemical Company
- 6.4.4 FUJIFILM Wako Pure Chemical Corporation
- 6.4.5 Haihang Industry
- 6.4.6 Hubei Kaiyuan Chemicals & Technology Co., Ltd.
- 6.4.7 Jiangsu Sanjili Chemical Co., LTD
- 6.4.8 Mitsui Chemicals, Inc.
- 6.4.9 Syensqo
- 6.4.10 TIANJIN ZHONGXIN CHEMTECH CO.,LTD.(ZX CHEMTECH)
- 6.4.11 UBE Corporation
- 6.4.12 Yancheng Fengyang Chemical Co., Ltd.
7 Market Opportunities and Future Outlook
- 7.1 White-space and Unmet-need Assessment

