
PUBLISHER: Mordor Intelligence | PRODUCT CODE: 1907299

PUBLISHER: Mordor Intelligence | PRODUCT CODE: 1907299
Military Radars - Market Share Analysis, Industry Trends & Statistics, Growth Forecasts (2026 - 2031)
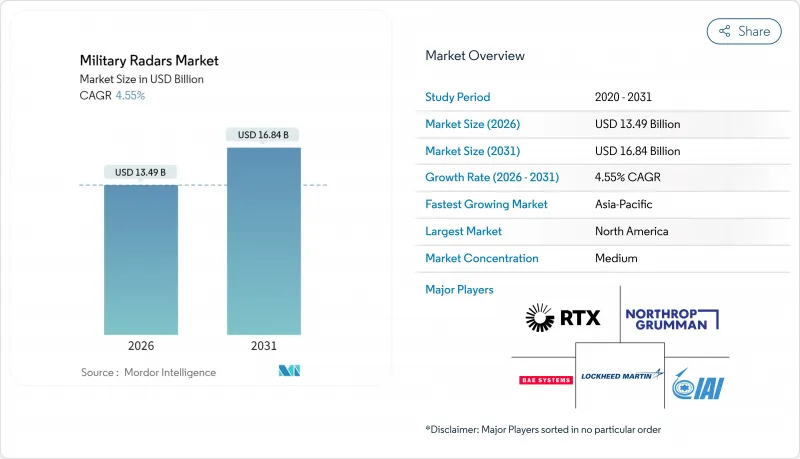
The military radars market was valued at USD 12.90 billion in 2025 and estimated to grow from USD 13.49 billion in 2026 to reach USD 16.84 billion by 2031, at a CAGR of 4.55% during the forecast period (2026-2031).
Mounting geopolitical tension, rapid counter-UAS requirements, and the transition from mechanically scanned arrays to software-defined AESA platforms are converging to reinforce demand. New constellations, such as the US Space Development Agency's Tracking Layer, demonstrate how space-based infrared data now hands off targets to ground radars in seconds, thereby tightening kill chains for hypersonic and swarm threats. Yet 5G spectrum encroachment and gallium nitride (GaN) semiconductor shortages prolong qualification cycles and elevate program risk. Platform demand is bifurcated: land systems still dominate revenue, but airborne and space sensors receive the highest R&D allocations. Software-defined radars (SDRs) lead the technology mix, while early quantum prototypes hint at the potential for disruptive long-term advancements.
Global Military Radars Market Trends and Insights
Growing Geopolitical Tensions and Defense Modernization Budgets
Defense spending reached a peacetime record in 2024 as 23 NATO members finally met the 2% of GDP pledge, allocating sizable funds to radar modernization programs. Poland's USD 4.75 billion Wisla initiative couples Patriot missiles with Giraffe 4A sensors to extend detection 400 km east. Taiwan boosted its 2024 radar budget by 7.7%, targeting phased-array upgrades for Tien Kung III interceptors. Japan followed with over-the-horizon procurements to close cruise-missile gaps exposed during North Korean tests. Together, these programs ensure a steady baseline for the military radars market through at least the medium term.
Rapid Deployment Needs for Counter-UAS and Hypersonic Threats
Hypersonic weapons compress the engagement window to under six minutes, challenging legacy sensors. The US orbited eight tracking satellites in 2024 to cue ground radars for terminal intercept. NATO's TWISTER program links TRML-4D ground arrays with space feeds to track glide vehicles. Saudi Arabia's installation of 47 KuRFS radars following the 2019 oil-facility strike underscores the growing urgency for counter-drone measures. Ukraine's 2024 battlefield adoption of more than 200 mobile counter-UAS radars further validates the trend. The demand for rapid-deployable, software-reconfigurable sensors, therefore, elevates the global military radars market's growth trajectory.
Supply-Chain Constraints for GaN Semiconductor Materials
The increasing use of GaN technology in military radar systems is straining the global supply chain for GaN semiconductor materials. GaN provides enhanced power density, thermal efficiency, and wide-band performance, making it critical for advanced AESA radar systems. However, its availability is constrained by various factors. Global GaN wafer capacity reached approximately 1.8 million six-inch-equivalent units in 2024; however, defense programs alone accounted for nearly one-quarter of that total, further tightening the supply. Wolfspeed reported 52-week lead times, pushing AN/TPY-4 deliveries nine months to the right. China, which refines 80% of gallium, imposed export licensing in 2023, forcing Western contractors to stockpile or certify alternative sources. US CHIPS Act funding earmarked less than 5% for GaN, so relief is unlikely before 2027. The bottleneck tempers near-term growth of the military radars market.
Other drivers and restraints analyzed in the detailed report include:
- Shift Toward Multi-Function AESA and SDR
- Integration of Radar Data Into JADC2 Architecture
- Spectrum-Allocation Pressures From Commercial 5G/6G Roll-Outs
For complete list of drivers and restraints, kindly check the Table Of Contents.
Segment Analysis
Land platforms accounted for 38.74% of the military radars market revenue in 2025, driven by established counter-battery and integrated air defense deployments along NATO's eastern flank and the Korean Peninsula. However, airborne sensors are expanding at a rate of 5.92% annually as nations accelerate AESA retrofits and deploy unmanned early-warning nodes. The E-7 Wedgetail procurement replaces aging E-3s and introduces Northrop Grumman's 180-track multi-role array, underscoring the momentum behind this initiative. Budget friction constrains near-term naval orders, yet Australia's Hobart-class upgrades and Japan's Aegis-equipped vessels sustain incremental demand. Space-based synthetic-aperture consortia, such as Capella Space, inject venture capital that targets 15-minute revisit times, aiming to extend the military radars market share into low-latitude imaging. Over the forecast horizon, land will stay the largest revenue pool. Yet, airborne and space domains will claim a rising portion of R&D budgets, signaling a gradual shift toward multi-domain mobility.
Tracking and fire control sensors held 31.12% of 2025 revenue, reflecting continued Patriot, THAAD, and Aegis modernization, while surveillance and AEW radars are projected to notch a 6.18% CAGR, the quickest pace in the military radars market. Germany's F126 frigate has chosen Thales Sea Fire, which is capable of guiding 16 missiles and maintaining continuous 360° coverage, illustrating the demand for consolidated functions. Counter-drone sensors, which were almost nonexistent five years ago, are now experiencing double-digit growth as urban air mobility (UAM) and consumer drone proliferation require affordable detection at short ranges. Weapon-locating and C-RAM procurements accelerated after Ukraine demonstrated the battlefield value of these systems. The shift toward software-switchable modes enables operators to upload new missions without swapping hardware, thereby helping the military radars market diversify beyond single-purpose line items.
The Military Radars Market Report is Segmented by Platform (Land, Naval, and More), Product Type (Surveillance and Airborne Early Warning Radars, and More), Technology (Software-Defined Radar, and More), Range (Short, Medium, and Long), Component (Antenna, Transmitter, Receiver, Signal Processor, and More), and Geography (North America, Europe, Asia-Pacific, and More). The Market Forecasts are Provided in Terms of Value (USD).
Geography Analysis
North America generated 36.95% of the 2025 revenue for the military radars market, buoyed by US Department of Defense outlays exceeding USD 850 billion, of which USD 4.8 billion was allocated to radar upgrades and new starts. The region leads in software-defined architectures and JADC2-ready interfaces, as exemplified by the AN/TPY-4 and LTAMDS programs. Canada's NORAD modernization adds Arctic demand, sustaining a medium-term pipeline.
The Asia-Pacific region is advancing at a 6.86% CAGR, the fastest rate worldwide. India's USD 650 million Uttam AESA production line, Japan's JPY 420 billion (USD 2.68 billion) radar modernization, and South Korea's KF-21 onboard AESA collectively illustrate regional indigenization and offset dynamics. China's assertive posture is driving its neighbors to accelerate procurement, positioning the Asia-Pacific region to challenge North American revenue leadership by the early 2030s.
Europe's growth is moderate as funds shift to munitions stockpiles after Ukraine's artillery usage. Poland's defense spending, accounting for 4.7% of its GDP, and Germany's EUR 350 million (USD 403.45 million) TRML-4D contract highlight targeted investments in the sector. The Middle East continues to utilize foreign military sales, with the UAE's MQ-9B package, including SeaVue maritime radars, valued at USD 290 million.
In contrast, South America and Africa remain smaller contributors, collectively accounting for less than 8% of revenue. Overall, geographic diversification helps mitigate cyclical risks and supports the steady growth of the military radars market.
- Lockheed Martin Corporation
- RTX Corporation
- Northrop Grumman Corporation
- Thales Group
- Leonardo S.p.A.
- Saab AB
- Hensoldt AG
- BAE Systems plc
- Israel Aerospace Industries
- Elbit Systems Ltd.
- L3Harris Technologies, Inc.
- Indra Sistemas S.A.
- Mitsubishi Electric Corporation
- Rohde & Schwarz GmbH
- NEC Corporation
- Bharat Electronics Limited
- Teledyne FLIR LLC
- Aselsan A.S.
- Terma A/S
Additional Benefits:
- The market estimate (ME) sheet in Excel format
- 3 months of analyst support
TABLE OF CONTENTS
1 INTRODUCTION
- 1.1 Study Assumptions and Market Definition
- 1.2 Scope of the Study
2 RESEARCH METHODOLOGY
3 EXECUTIVE SUMMARY
4 MARKET LANDSCAPE
- 4.1 Market Overview
- 4.2 Market Drivers
- 4.2.1 Growing geopolitical tensions and defense modernisation budgets
- 4.2.2 Rapid deployment needs for counter-UAS and hypersonic threats
- 4.2.3 Shift toward multi-function AESA and software-defined radar
- 4.2.4 Integration of radar data into joint all-domain command-and-control (CJADC2)
- 4.2.5 Modular open-systems architecture (MOSA) driving life-cycle cost savings
- 4.2.6 Under-ice and Arctic surveillance requirements due to polar route opening
- 4.3 Market Restraints
- 4.3.1 Supply-chain constraints for GaN semiconductor materials
- 4.3.2 Spectrum-allocation pressures from commercial 5G/6G roll-outs
- 4.3.3 Cyber-vulnerabilities in network-centric radar architectures
- 4.3.4 Capital-intensive testing and certification for multi-band systems
- 4.4 Value Chain Analysis
- 4.5 Regulatory Landscape
- 4.6 Technological Outlook
- 4.7 Porter's Five Forces Analysis
- 4.7.1 Bargaining Power of Suppliers
- 4.7.2 Bargaining Power of Buyers/Consumers
- 4.7.3 Threat of New Entrants
- 4.7.4 Threat of Substitutes
- 4.7.5 Intensity of Competitive Rivalry
5 MARKET SIZE AND GROWTH FORECASTS (VALUE)
- 5.1 By Platform
- 5.1.1 Land
- 5.1.2 Naval
- 5.1.3 Airborne
- 5.1.4 Space
- 5.2 By Product Type
- 5.2.1 Surveillance and Airborne Early Warning Radars
- 5.2.2 Tracking and Fire Control Radars
- 5.2.3 Multifunction Radars
- 5.2.4 Weapon Locating and C-RAM Radars
- 5.2.5 Ground Penetrating Radars
- 5.2.6 Weather Radars
- 5.2.7 Counter-Drone Radars
- 5.2.8 Other
- 5.3 By Technology
- 5.3.1 Software-Defined Radars
- 5.3.2 Conventional Radars
- 5.3.3 Quantum Radars
- 5.4 By Range
- 5.4.1 Short-range
- 5.4.2 Medium-range
- 5.4.3 Long-range
- 5.5 By Component
- 5.5.1 Antenna
- 5.5.2 Transmitter
- 5.5.3 Receiver
- 5.5.4 Signal Processor
- 5.5.5 Power Amplifier
- 5.5.6 Stabilization Systems
- 5.5.7 Other
- 5.6 By Geography
- 5.6.1 North America
- 5.6.1.1 United States
- 5.6.1.2 Canada
- 5.6.1.3 Mexico
- 5.6.2 South America
- 5.6.2.1 Brazil
- 5.6.2.2 Rest of South America
- 5.6.3 Europe
- 5.6.3.1 United Kingdom
- 5.6.3.2 Germany
- 5.6.3.3 France
- 5.6.3.4 Russia
- 5.6.3.5 Rest of Europe
- 5.6.4 Asia-Pacific
- 5.6.4.1 China
- 5.6.4.2 Japan
- 5.6.4.3 South Korea
- 5.6.4.4 India
- 5.6.4.5 Australia
- 5.6.4.6 Rest of Asia Pacific
- 5.6.5 Middle East and Africa
- 5.6.5.1 Middle East
- 5.6.5.1.1 UAE
- 5.6.5.1.2 Saudi Arabia
- 5.6.5.1.3 Israel
- 5.6.5.1.4 Rest of Middle East
- 5.6.5.2 Africa
- 5.6.5.2.1 South Africa
- 5.6.5.2.2 Rest of Africa
- 5.6.5.1 Middle East
- 5.6.1 North America
6 COMPETITIVE LANDSCAPE
- 6.1 Market Concentration
- 6.2 Strategic Moves
- 6.3 Market Share Analysis
- 6.4 Company Profiles {(includes Global level Overview, Market level overview, Core Segments, Financials as available, Strategic Information, Market Rank/Share for key companies, Products amd Services, and Recent Developments)}
- 6.4.1 Lockheed Martin Corporation
- 6.4.2 RTX Corporation
- 6.4.3 Northrop Grumman Corporation
- 6.4.4 Thales Group
- 6.4.5 Leonardo S.p.A.
- 6.4.6 Saab AB
- 6.4.7 Hensoldt AG
- 6.4.8 BAE Systems plc
- 6.4.9 Israel Aerospace Industries
- 6.4.10 Elbit Systems Ltd.
- 6.4.11 L3Harris Technologies, Inc.
- 6.4.12 Indra Sistemas S.A.
- 6.4.13 Mitsubishi Electric Corporation
- 6.4.14 Rohde & Schwarz GmbH
- 6.4.15 NEC Corporation
- 6.4.16 Bharat Electronics Limited
- 6.4.17 Teledyne FLIR LLC
- 6.4.18 Aselsan A.S.
- 6.4.19 Terma A/S
7 MARKET OPPORTUNITIES AND FUTURE OUTLOOK
- 7.1 White-space and Unmet-need Assessment

