
PUBLISHER: Mordor Intelligence | PRODUCT CODE: 1907309

PUBLISHER: Mordor Intelligence | PRODUCT CODE: 1907309
Pharmaceutical Contract Manufacturing Organization (CMO) - Market Share Analysis, Industry Trends & Statistics, Growth Forecasts (2026 - 2031)
The pharmaceutical contract manufacturing organization market is expected to grow from USD 184.44 billion in 2025 to USD 196.33 billion in 2026 and is forecast to reach USD 268.37 billion by 2031 at 6.45% CAGR over 2026-2031.
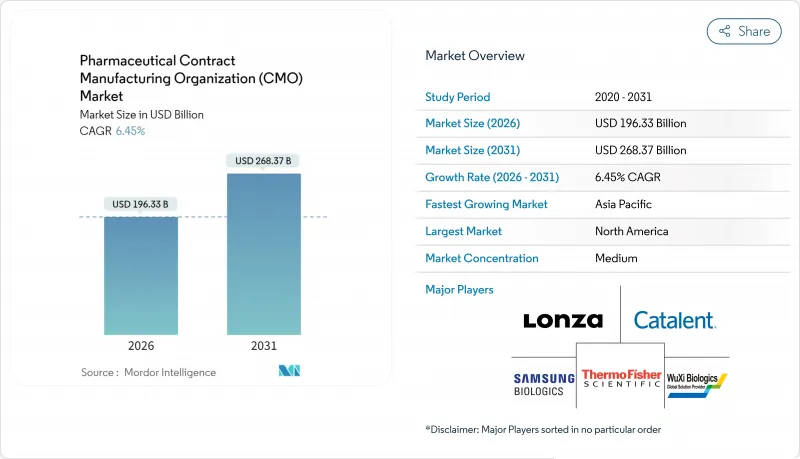
Momentum stems from the industry's strategic realignment toward core discovery and commercialization tasks, leaving complex production activities to specialized partners. Venture-capital inflows into virtual biotechs, record approvals of advanced therapies, and expanding high-potency API pipelines are reinforcing the shift toward external capacity. Meanwhile, cost pressures, regulatory scrutiny, and the need for state-of-the-art technologies are motivating big pharma, specialty players, and generics alike to deepen collaboration with qualified contract manufacturers. Providers able to bundle development, scale-up, and fill-finish services while maintaining global quality standards continue to capture disproportionate opportunities within the pharmaceutical contract manufacturing organization market.
Global Pharmaceutical Contract Manufacturing Organization (CMO) Market Trends and Insights
Accelerating Small and Mid-Sized Pharma Outsourcing
Escalating compliance costs after the FDA's 2024 inspection overhaul elevated annual quality expenses by USD 2-5 million for mid-tier plants. The capital burden is steering resource-constrained sponsors toward strategic outsourcing across oncology and rare-disease portfolios. Contract manufacturers with integrated development and commercial capabilities benefit from predictable pipeline inflows, while hybrid fee-for-service and risk-sharing models are gaining traction.
Rising Biologics Pipeline Complexity
Multi-specific antibodies, antibody-drug conjugates, and autologous cell therapies require distinctive upstream cell culture, purification, and cold-chain infrastructure that few innovators can justify in-house. Samsung Biologics committed USD 2.4 billion in 2024 to expand single-use bioreactor capacity, signaling the scale of investment necessary for modern biologics production. Providers offering turnkey process development, viral clearance, and fill-finish services are now critical partners across biologics life cycles.
Capacity Bottlenecks in Fill-Finish Lines
Utilization above 85% and lead times exceeding 18 months for complex injectables limit CDMOs' ability to absorb new biologics programs. Sterile suites, advanced robotics, and serialization upgrades demand multi-year investments that delay relief, keeping short-term supply tight and potentially constraining near-term revenue realization.
Other drivers and restraints analyzed in the detailed report include:
- Increasing Venture-Capital-Funded Virtual Biotechs
- Demand Spike for High-Potency APIs (HPAPIs)
- Escalating Regulatory Inspections and Remediation Costs
For complete list of drivers and restraints, kindly check the Table Of Contents.
Segment Analysis
API manufacturing held 41.98% of pharmaceutical contract manufacturing organization market share in 2025, underpinning broad generic and branded drug demand. While small-molecule volumes stay dominant, biologics and HPAPI capacity additions are shifting revenue mix toward higher-value offerings. Clients increasingly seek integrated services that co-locate synthesis, purification, and final dosage manufacturing to eliminate supply handoffs.
Contractors offering both solid-dose and injectable dose formulation capture economies of scope. Digital serialization, continuous manufacturing, and predictive maintenance are reshaping operating cost curves, creating new competitive thresholds for entry. Integration with packaging services, particularly tamper-evident and track-and-trace solutions, further differentiates providers.
Small molecules still accounted for 56.85% of 2025 revenue, yet advanced therapies pushed the fastest expansion at an 8.22% CAGR. Viral vector production, cell expansion know-how, and cryogenic storage now dominate CAPEX priorities as developers chase one-time curative potential. The pharmaceutical contract manufacturing organization market size for advanced therapies is projected to broaden as more approved products transition from autologous to allogeneic processes, necessitating larger, standardized manufacturing runs.
Biologics occupy an intermediate growth position thanks to biosimilar adoption and novel antibody formats. Sustained investment across all molecule classes affirms the strategic imperative for CDMOs to maintain diversified technology portfolios rather than single-platform specialisms.
The Pharmaceutical Contract Manufacturing Organization Report is Segmented by Service Type (API Manufacturing, and More), Drug Molecule Type (Small Molecule, Biologics, and Advanced Therapies), Scale of Operation (Clinical-Phase Manufacturing, and More), End User (Big Pharma, Generic Pharma, and More), Therapeutic Area (Oncology, Cardiovascular, and More), and Geography. The Market Forecasts are Provided in Terms of Value (USD).
Geography Analysis
North America held 39.85% of 2025 revenue, supported by strong intellectual property frameworks, proximity to drug innovators, and deep regulatory expertise. Ongoing investment in continuous manufacturing and cell-therapy infrastructure keeps the region a preferred partner location, though high labor costs limit incremental capacity additions.
Asia-Pacific is the fastest-growing region at a 8.91% CAGR, propelled by scale investments in China, India, and South Korea. Samsung Biologics' USD 2.4 billion build-out exemplifies regional commitment to state-of-the-art biologics capacity. Currency volatility and evolving quality expectations pose operational challenges, yet lower fixed costs and government incentives sustain its attractiveness within the pharmaceutical contract manufacturing organization market.
Europe enjoys stable demand thanks to established clusters in Germany, Ireland, Switzerland, and Scandinavia. Harmonized EMA regulations foster cross-border supply chains, particularly in advanced therapies. Middle East and Africa remain nascent but show potential as governments pursue medicine security and local manufacturing mandates.
- Lonza Group Ltd.
- Catalent Inc.
- Thermo Fisher Scientific Inc.
- Samsung Biologics Co. Ltd.
- WuXi Biologics (Cayman) Inc.
- Recipharm AB
- Jubilant Pharmova Ltd.
- Boehringer Ingelheim GmbH
- Pfizer CentreOne (Pfizer Inc.)
- Baxter International Inc. (Baxter BioPharma Solutions)
- Aenova Holding GmbH
- PCI Pharma Services
- Cambrex Corporation
- Siegfried Holding AG
- Evonik Industries AG
- Alcami Corporation
- Ajinomoto Bio-Pharma Services
- Eurofins CDMO Alphora Inc.
- Famar SA
- Tapemark LLC
Additional Benefits:
- The market estimate (ME) sheet in Excel format
- 3 months of analyst support
TABLE OF CONTENTS
1 INTRODUCTION
- 1.1 Study Assumptions and Market Definition
- 1.2 Scope of the Study
2 RESEARCH METHODOLOGY
3 EXECUTIVE SUMMARY
4 MARKET LANDSCAPE
- 4.1 Market Overview
- 4.2 Market Drivers
- 4.2.1 Accelerating small and mid-sized pharma outsourcing
- 4.2.2 Rising biologics pipeline complexity
- 4.2.3 Increasing venture-capital funded virtual biotechs
- 4.2.4 Demand spike for high-potency APIs (HPAPIs)
- 4.2.5 Growth of cell and gene therapy CDMO capacity
- 4.2.6 ESG-linked supply chain qualification
- 4.3 Market Restraints
- 4.3.1 Capacity bottlenecks in fill-finish lines
- 4.3.2 Escalating regulatory inspections and remediation costs
- 4.3.3 Volatile single-use-systems supply
- 4.3.4 Currency-driven cost inflation in emerging hubs
- 4.4 Industry Value Chain Analysis
- 4.5 Regulatory Landscape
- 4.6 Technological Outlook
- 4.7 Porter's Five Forces Analysis
- 4.7.1 Bargaining Power of Suppliers
- 4.7.2 Bargaining Power of Buyers
- 4.7.3 Threat of New Entrants
- 4.7.4 Intensity of Competitive Rivalry
- 4.7.5 Threat of Substitute Products
- 4.8 Impact of Macroeconomic Factors
- 4.9 Investment Analysis
5 MARKET SIZE AND GROWTH FORECASTS (VALUE)
- 5.1 By Service Type
- 5.1.1 API Manufacturing
- 5.1.1.1 Small Molecule
- 5.1.1.2 Large Molecule
- 5.1.1.3 High-Potency API (HPAPI)
- 5.1.2 FDF Development and Manufacturing
- 5.1.2.1 Solid Dose
- 5.1.2.2 Liquid Dose
- 5.1.2.3 Injectable Dose
- 5.1.3 Secondary Packaging
- 5.1.1 API Manufacturing
- 5.2 By Drug Molecule Type
- 5.2.1 Small Molecule
- 5.2.2 Biologics
- 5.2.3 Advanced Therapies (Cell and Gene)
- 5.3 By Scale of Operation
- 5.3.1 Clinical-Phase Manufacturing
- 5.3.2 Commercial-Scale Manufacturing
- 5.4 By End User
- 5.4.1 Big Pharma
- 5.4.2 Generic Pharma
- 5.4.3 Emerging / Virtual Biotech
- 5.4.4 Specialty Pharma
- 5.5 By Therapeutic Area
- 5.5.1 Oncology
- 5.5.2 Cardiovascular
- 5.5.3 Central Nervous System (CNS)
- 5.5.4 Infectious Disease
- 5.5.5 Other Therapeutic Areas
- 5.6 By Geography
- 5.6.1 North America
- 5.6.1.1 United States
- 5.6.1.2 Canada
- 5.6.1.3 Mexico
- 5.6.2 South America
- 5.6.2.1 Brazil
- 5.6.2.2 Argentina
- 5.6.2.3 Rest of South America
- 5.6.3 Europe
- 5.6.3.1 United Kingdom
- 5.6.3.2 Germany
- 5.6.3.3 France
- 5.6.3.4 Spain
- 5.6.3.5 Italy
- 5.6.3.6 Rest of Europe
- 5.6.4 Asia-Pacific
- 5.6.4.1 China
- 5.6.4.2 India
- 5.6.4.3 Japan
- 5.6.4.4 Australia
- 5.6.4.5 South Korea
- 5.6.4.6 Rest of Asia-Pacific
- 5.6.5 Middle East and Africa
- 5.6.5.1 Middle East
- 5.6.5.1.1 Saudi Arabia
- 5.6.5.1.2 United Arab Emirates
- 5.6.5.1.3 Turkey
- 5.6.5.1.4 Rest of Middle East
- 5.6.5.2 Africa
- 5.6.5.2.1 South Africa
- 5.6.5.2.2 Kenya
- 5.6.5.2.3 Rest of Africa
- 5.6.5.1 Middle East
- 5.6.1 North America
6 COMPETITIVE LANDSCAPE
- 6.1 Market Concentration
- 6.2 Strategic Moves
- 6.3 Market Share Analysis
- 6.4 Company Profiles (includes Global level Overview, Market level overview, Core Segments, Financials as available, Strategic Information, Market Rank/Share for key companies, Products and Services, and Recent Developments)
- 6.4.1 Lonza Group Ltd.
- 6.4.2 Catalent Inc.
- 6.4.3 Thermo Fisher Scientific Inc.
- 6.4.4 Samsung Biologics Co. Ltd.
- 6.4.5 WuXi Biologics (Cayman) Inc.
- 6.4.6 Recipharm AB
- 6.4.7 Jubilant Pharmova Ltd.
- 6.4.8 Boehringer Ingelheim GmbH
- 6.4.9 Pfizer CentreOne (Pfizer Inc.)
- 6.4.10 Baxter International Inc. (Baxter BioPharma Solutions)
- 6.4.11 Aenova Holding GmbH
- 6.4.12 PCI Pharma Services
- 6.4.13 Cambrex Corporation
- 6.4.14 Siegfried Holding AG
- 6.4.15 Evonik Industries AG
- 6.4.16 Alcami Corporation
- 6.4.17 Ajinomoto Bio-Pharma Services
- 6.4.18 Eurofins CDMO Alphora Inc.
- 6.4.19 Famar SA
- 6.4.20 Tapemark LLC
7 MARKET OPPORTUNITIES AND FUTURE OUTLOOK
- 7.1 White-Space and Unmet-Need Assessment

