
PUBLISHER: Mordor Intelligence | PRODUCT CODE: 1907317

PUBLISHER: Mordor Intelligence | PRODUCT CODE: 1907317
Niobium - Market Share Analysis, Industry Trends & Statistics, Growth Forecasts (2026 - 2031)
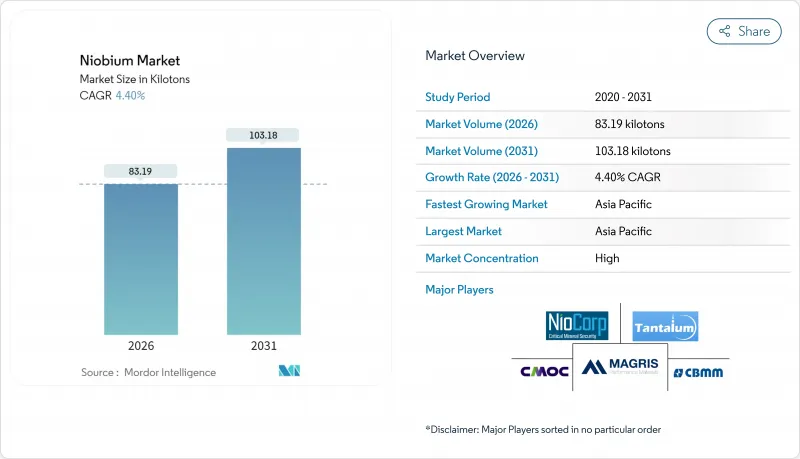
The Niobium market is expected to grow from 79.68 kilotons in 2025 to 83.19 kilotons in 2026 and is forecast to reach 103.18 kilotons by 2031 at 4.4% CAGR over 2026-2031.
Sustained demand for high-strength low-alloy (HSLA) steel in construction and automotive manufacturing anchors this expansion because micro-additions of the element raise tensile strength by up to 30% while preserving weldability. Price stability between USD 45-50 per kilogram, maintained by a concentrated supply base led by Brazil, encourages long-term offtake agreements that lower procurement risk for large infrastructure projects. Rising interest in niobium-doped battery anodes, quantum-grade superconductors, and hydrogen-ready pipeline steels is broadening end-market diversity, cushioning the niobium market against potential slowdowns in the steel cycle. Supply-side diversification efforts in Canada and the United States aim to mitigate geopolitical risk tied to Brazil's dominance and to reinforce domestic critical-minerals strategies.
Global Niobium Market Trends and Insights
Rising HSLA Steel Adoption in Construction
Building-code revisions now mandate higher strength-to-weight ratios for seismic resilience, and HSLA steels containing 0.02-0.05% niobium deliver 20-30% strength gains over conventional grades while cutting tonnage requirements. China's 2024 seismic standards explicitly cite niobium-microalloyed steels for high-rise projects, and similar updates are under review in Indonesia and Mexico. Because material cost premiums remain 5-8% yet structural steel volumes fall by up to 20%, engineering firms are embedding niobium specifications across long-term infrastructure plans. As new urbanization waves in Asia and Africa accelerate, construction demand anchors more than 49% of overall niobium consumption, reinforcing a stable baseline for the niobium market. Regulatory momentum makes HSLA adoption essentially irreversible within a decade horizon.
Lightweighting Push in Automotive and Shipbuilding
Stricter fuel-economy targets and maritime emission limits foster aggressive mass-reduction strategies. Advanced high-strength steels incorporating niobium now appear in over 60% of premium-segment vehicles and are migrating into mass-market platforms as OEMs balance crashworthiness with battery-induced weight penalties. In shipbuilding, cryogenic-grade HSLA plate with niobium additions satisfies LNG-carrier requirements for fracture toughness at -162 °C, supporting fleet renewal across South Korea and Qatar. Commercial trucking and railcar builders likewise gravitate toward niobium-enhanced beam and chassis components, improving payload efficiency without major design overhauls. The cross-modal adoption cycle positions the niobium market for multi-industry synergies rather than single-sector dependency.
Acute-exposure Health and Environmental Concerns
Niobium ores often coexist with thorium and uranium, necessitating strict radiological surveillance during mining. Regulatory authorities in Brazil now require groundwater baselines and isotopic mapping before license renewals, adding 15-25% to compliance costs. Indigenous-territory debates further delay greenfield approvals, and similar community-engagement hurdles appear in Canada's Ring of Fire region. While no chronic-toxicity cases have been documented at industrial exposure levels, public perception risks can influence capex decisions, tempering supply-side agility.
Other drivers and restraints analyzed in the detailed report include:
- Pipeline Build-out for Hydrogen and LNG Transmission
- Niobium-doped Li-ion Batteries Scale-up
- ESG Traceability Compliance Costs
For complete list of drivers and restraints, kindly check the Table Of Contents.
Segment Analysis
Carbonatite-hosted deposits held 95.85% of the 2025 global supply and are set to expand at a 4.43% CAGR through 2031, underpinning the niobium market size growth trajectory. Brazil's Araxa mine exemplifies low-strip ratios and coarse-grained pyrochlore that simplify beneficiation, yielding ferroniobium at competitive opex levels.
Exploration spending now targets undercover carbonatites in Greenland and Tanzania; however, no discovery approaches Araxa's scale, reinforcing existing supply concentration. Predictable mineralogy and decades of metallurgical know-how translate into steady throughput, anchoring long-term delivery contracts and reinforcing the niobium market's pricing stability. Strategic stockpilers in Japan and Germany continue to favor carbonatite feed due to consistent impurity profiles that streamline alloy-shop quality control.
Ferroniobium accounted for 92.75% of 2025 shipments and is forecast to post a 4.35% CAGR through 2031, mirroring global crude-steel demand patterns. The master alloy, usually containing 65% niobium, integrates seamlessly into basic-oxygen furnace practices, enabling melt-shop engineers to fine-tune grain size and precipitation kinetics. Niobium oxide, while representing a minor share today, is pacing up on the back of battery and dielectric-ceramic uptake; CBMM's dedicated oxide line targets 40,000 tons annual capacity by 2030.
Vacuum-grade metal and specialty alloy powders feed aerospace engines, MRI magnets, and quantum devices, commanding premium unit values in spite of small tonnages. As additive manufacturing spreads, demand for spherical C-103 powder is likely to outpace bulk plate and bar, diversifying revenue streams for converters. Consequently, ferroniobium will remain the volume anchor, but high-purity derivatives will shape margin dynamics across the niobium industry.
The Niobium Report is Segmented by Occurrence (Carbonatites and Associates and Columbite-Tantalite), Type (Ferroniobium, Niobium Oxide, and More), Application (Steel, Super-Alloys, Superconducting Magnets and Capacitors, and More), End-User Industry (Construction, Automotive and Shipbuilding, Aerospace and Defense, and More), and Geography (Asia-Pacific, North America, Europe, South America, and Middle-East and Africa).
Geography Analysis
Asia-Pacific held 60.10% of 2025 global volume and is forecast to grow at a 4.71% CAGR to 2031, securing the largest regional slice of the niobium market. China's gargantuan steel output and evolving seismic codes sustain bulk demand, while aerospace programs exploring niobium-silicon alloys extend uptake into next-generation propulsion systems.
North America's growth hinges on dual themes: decarbonization of transport fleets and defense-driven hypersonic development. Tightened EPA fuel-economy rules and state-level zero-emission mandates push OEMs toward niobium-enriched steels for chassis mass reduction, counterbalancing heavier battery systems. Canada's Niobec mine supplies roughly 8-10% of global output, but U.S. policymakers continue to view diversification via Elk Creek as a strategic imperative to curb reliance on Brazilian imports.
Europe targets net-zero targets by expanding hydrogen pipelines that demand niobium-microalloyed API X70 grades, and stringent vehicle CO2 limits sustain high-strength steel penetration in automotive stamping. Germany's auto clusters integrate ferroniobium additions to deliver lighter body-in-white assemblies, while Norway's mineral strategy lists niobium as a priority for domestic exploration under revised permitting rules. The region also supports fundamental research into niobium-tin superconductors for CERN's accelerator upgrades, sustaining a research-driven niche inside the broader niobium market.
- Admat Inc.
- American Elements
- Australian Strategic Materials Ltd
- CBMM
- Changsha South Tantalum Niobium Co. Ltd
- CMOC
- Grandview Materials
- Magris Performance Materials
- NioCorp Development Ltd
- Titanex GmbH
Additional Benefits:
- The market estimate (ME) sheet in Excel format
- 3 months of analyst support
TABLE OF CONTENTS
1 Introduction
- 1.1 Study Assumptions and Market Definition
- 1.2 Scope of the Study
2 Research Methodology
3 Executive Summary
4 Market Landscape
- 4.1 Market Overview
- 4.2 Market Drivers
- 4.2.1 Rising HSLA Steel Adoption in Construction
- 4.2.2 Lightweighting Push in Automotive and Shipbuilding
- 4.2.3 Pipeline Build-Out for Hydrogen and LNG Transmission
- 4.2.4 Niobium-Doped Li-Ion Batteries Scale-Up
- 4.2.5 Additive-Manufactured Nb Alloys for Aerospace
- 4.3 Market Restraints
- 4.3.1 Supply Concentration in Brazil and Pricing Power
- 4.3.2 Acute-Exposure Health and Environmental Concerns
- 4.3.3 ESG Traceability Compliance Costs
- 4.4 Porter's Five Forces
- 4.4.1 Bargaining Power of Suppliers
- 4.4.2 Bargaining Power of Buyers
- 4.4.3 Threat of New Entrants
- 4.4.4 Threat of Substitutes
- 4.4.5 Degree of Competition
- 4.5 Technological Snapshot/ Production Analysis
- 4.6 Price Trends
5 Market Size and Growth Forecasts (Volume)
- 5.1 By Occurrence
- 5.1.1 Carbonatites and Associates
- 5.1.2 Columbite-Tantalite
- 5.2 By Type
- 5.2.1 Ferroniobium
- 5.2.2 Niobium Oxide
- 5.2.3 Niobium Metal
- 5.2.4 Vacuum-grade Nb Alloys
- 5.3 By Application
- 5.3.1 Steel
- 5.3.2 Super-alloys
- 5.3.3 Superconducting Magnets and Capacitors
- 5.3.4 Batteries
- 5.3.5 Other Applications
- 5.4 By End-user Industry
- 5.4.1 Construction
- 5.4.2 Automotive and Shipbuilding
- 5.4.3 Aerospace and Defense
- 5.4.4 Oil and Gas
- 5.4.5 Other End-users
- 5.5 By Geography
- 5.5.1 Asia-Pacific
- 5.5.1.1 China
- 5.5.1.2 India
- 5.5.1.3 Japan
- 5.5.1.4 South Korea
- 5.5.1.5 Rest of Asia-Pacific
- 5.5.2 North America
- 5.5.2.1 United States
- 5.5.2.2 Canada
- 5.5.2.3 Mexico
- 5.5.3 Europe
- 5.5.3.1 Germany
- 5.5.3.2 United Kingdom
- 5.5.3.3 Russia
- 5.5.3.4 Italy
- 5.5.3.5 Rest of Europe
- 5.5.4 South America
- 5.5.4.1 Brazil
- 5.5.4.2 Argentina
- 5.5.4.3 Rest of South America
- 5.5.5 Middle-East and Africa
- 5.5.5.1 Saudi Arabia
- 5.5.5.2 South Africa
- 5.5.5.3 Rest of Middle-East and Africa
- 5.5.1 Asia-Pacific
6 Competitive Landscape
- 6.1 Market Concentration
- 6.2 Strategic Moves
- 6.3 Market Share (%)/Ranking Analysis
- 6.4 Company Profiles (includes Global-level Overview, Market-level Overview, Core Segments, Financials as available, Strategic Information, Market Rank/Share, Products and Services, Recent Developments)
- 6.4.1 Admat Inc.
- 6.4.2 American Elements
- 6.4.3 Australian Strategic Materials Ltd
- 6.4.4 CBMM
- 6.4.5 Changsha South Tantalum Niobium Co. Ltd
- 6.4.6 CMOC
- 6.4.7 Grandview Materials
- 6.4.8 Magris Performance Materials
- 6.4.9 NioCorp Development Ltd
- 6.4.10 Titanex GmbH
7 Market Opportunities and Future Outlook
- 7.1 White-space and Unmet-need Assessment

