
PUBLISHER: Mordor Intelligence | PRODUCT CODE: 1910461

PUBLISHER: Mordor Intelligence | PRODUCT CODE: 1910461
Personal Care Chemicals - Market Share Analysis, Industry Trends & Statistics, Growth Forecasts (2026 - 2031)
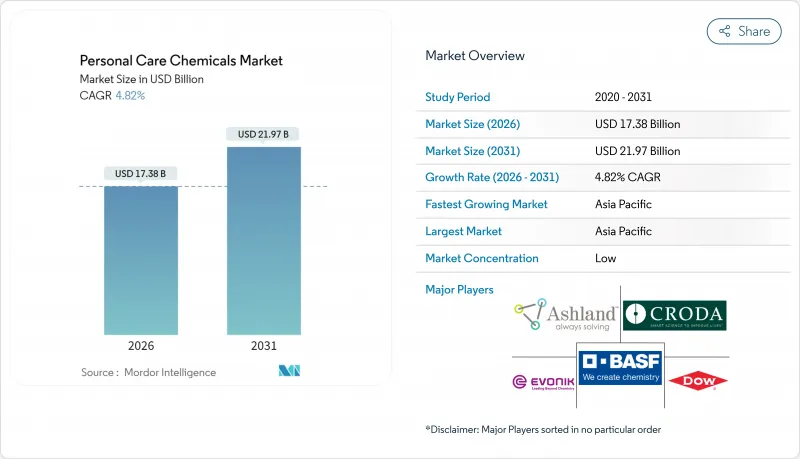
The Personal Care Chemicals Market was valued at USD 16.58 billion in 2025 and estimated to grow from USD 17.38 billion in 2026 to reach USD 21.97 billion by 2031, at a CAGR of 4.82% during the forecast period (2026-2031).
Demand tilts toward clinically proven actives even though inactives still dominate volumes, and suppliers with data-backed efficacy enjoy pricing power. The Asia-Pacific region leads absolute growth as rising disposable incomes in China and India shift household budgets toward premium skincare. Regulatory bans on microplastics in Europe, combined with AI-enabled formulation tools, accelerate portfolio renewal at large incumbents. Ongoing feedstock volatility and water scarcity in high-growth regions compel formulators to favor bio-based and anhydrous systems, which reduce exposure to crude oil cycles and rinse-off formats.
Global Personal Care Chemicals Market Trends and Insights
Growing Demand for Premium Skin Care Actives
Peptide complexes and encapsulated retinoids command prices higher than commodity emollients, yet they represent only a small share of total formulation cost, which creates attractive margins for suppliers able to validate efficacy. Adoption of bakuchiol tripled between 2023 and 2025 as retinoid-sensitive users sought gentler options, and Sytenol A now features in more than 120 global SKUs. Niacinamide claims, supported by clear mechanisms that inhibit melanosome transfer, push suppliers to invest in clinical dossiers that raise barriers for generic entrants. Co-development agreements that offer temporary exclusivity are proliferating; Estee Lauder secured a 24-month lead on a fermented yeast extract through collaboration with DSM. Suppliers that own dermatological testing centers and patented delivery platforms gain a lasting advantage as brands continue to pay premiums for proven active ingredients.
Expansion of Middle Class Spending in Asia-Pacific
In 2024, China boasted a significant number of urban middle-class households, with skincare now claiming a larger share of their annual budgets compared to 2019. Local brands, such as Proya, are combining traditional Chinese medicine extracts, including ginseng and goji, with contemporary actives, collectively capturing a notable portion of China's premium skincare market. In 2024, India experienced substantial growth, driven by rising incomes in Tier 2 and Tier 3 cities, where there's a growing emphasis on UV protection and anti-pollution features. Leveraging South Korean fermentation expertise in galactomyces and bifida extracts, Cosmax BTI witnessed a significant revenue surge in 2024, as global brands increasingly sourced K-beauty ingredients. In Indonesia and Vietnam, halal-certified cosmetics experienced consistent annual growth, prompting suppliers to seek JAKIM accreditation to cater to the needs of Muslim consumers.
Strict Bans on Microplastics and Certain Preservatives
The European Union outlawed intentionally added microplastics under 5 millimeters in October 2023, affecting numerous SKUs that relied on polyethylene or polypropylene beads. Cellulose beads and jojoba esters replace the banned exfoliants, but this results in increased material costs. Rheology modifiers based on acrylate copolymers also face scrutiny, steering formulators toward xanthan and guar gums that deliver stickier sensorial profiles. The ban on methylisothiazolinone in leave-on products removes a low-cost, broad-spectrum preservative, forcing the use of multicomponent systems that complicate stability testing. Ashland responded with Spectrastat, a multifunctional preservative that doubles as an emollient, helping brands maintain shorter ingredient lists. Compliance audits and reformulation fees pose a burden that weighs heavily on indie labels.
Other drivers and restraints analyzed in the detailed report include:
- Shift Toward Natural and Sustainable Ingredients
- E-Commerce Acceleration of Niche Beauty Brands
- Volatile Petro Derivative Costs
For complete list of drivers and restraints, kindly check the Table Of Contents.
Segment Analysis
Inactive ingredients held 61.68% of the personal care chemicals market share in 2025, as water, emulsifiers, and thickeners make up the majority of the product weight. However, active ingredients are expected to expand at 5.27% through 2031, outpacing inactives as brands justify premiums with clinical evidence. Surfactants face margin erosion from renewable routes that carry premiums, yet remain affordable only for premium labels. Emollients and emulsifiers remain essential for texture and sensory feel, although innovation now focuses on tactile refinement rather than new chemistry. Colorants and preservatives face tighter regulations, and natural gums are increasingly displacing carbomers, even though they offer lower viscosity stability.
Peptides, mineral UV filters, and antioxidants headline the active surge, with conditioning agents for hair representing a significant portion of active revenue. The personal care chemicals market for UV actives expanded as dermatologists emphasized the importance of daily protection. Retinoids and palmitoyl peptides demonstrated notable wrinkle depth reduction in trials, which lets brands sell serums at premium prices. Enzymatic exfoliants, such as papain, offer gentler performance for sensitive skin, although they require cold-chain logistics that increase costs. Consumers scrutinize ingredient lists more than brand narratives, which compels suppliers to protect patents and fund clinical programs to sustain margins within the personal care chemicals market.
The Personal Care Chemicals Market Report is Segmented by Ingredient (Inactive Ingredients: Surfactants, Emulsifiers, Emollients, Colorants and Preservatives, and More; Active Ingredients: Conditioning Agents, UV Ingredients, and More), Application (Skin Care, Hair Care, Make-Up, Fragrances, Oral Care, and Toiletries), and Geography (Asia-Pacific, North America, and More). The Market Forecasts are Provided in Terms of Value (USD).
Geography Analysis
Asia-Pacific generated 30.18% of 2025 revenue and will post a 6.05% CAGR to 2031, driven by urban middle-class households in countries like China, where skincare spending is increasing. Companies exporting fermentation-derived actives have seen growth as global buyers seek effective solutions at scale. India is experiencing growth under government incentive schemes that support domestic chemical production and attract investments from major players. ASEAN countries are focusing on halal-certified cosmetics, which cater to a large Muslim consumer base. Japan, however, has faced challenges due to demographic aging, leading suppliers to shift their focus toward younger populations in other countries within the region.
North America remains a key market. Regulatory changes, such as the FDA's reclassification of organic UV filters, may impact the launch of sunscreens and shift demand toward mineral-based alternatives. Canada has introduced additional restrictions on cosmetic ingredients, prompting updates to numerous product formulations. Nearshoring efforts have increased production capacity in Mexico, supporting U.S. brands in their quest for more resilient supply chains. Europe enforces some of the strictest cosmetic chemical regulations globally, including a phase-out of microplastics, which has led to reformulation efforts. Key markets, such as Germany, France, and the United Kingdom, continue to prioritize certified sustainable ingredients.
South America is experiencing growth, with Brazilian brands emphasizing the use of Amazonian botanicals that appeal to sustainability-conscious consumers. Argentina faces economic challenges that impact discretionary spending, while Chile benefits from urban affluence, driving demand. The Middle East and Africa are also growing markets, but face challenges such as water scarcity. Saudi Arabia's upcoming excise tax on rinse-off formats is encouraging the adoption of anhydrous products, creating opportunities for concentrated formats. South Africa benefits from stable surfactant costs due to integrated supply chains, while the UAE sees increased demand for halal-certified products driven by high-income Muslim consumers.
- Ashland
- BASF
- Clariant
- Croda International Plc
- Dow
- DSM
- Evonik Industries AG
- GALAXY
- Innospec
- Kao Corporation
- Lonza
- Merck KGaA
- Momentive
- Nouryon
- Sasol
- Solvay
- Stepan Company
- Symrise
- The Lubrizol Corporation
- Wacker Chemie AG
Additional Benefits:
- The market estimate (ME) sheet in Excel format
- 3 months of analyst support
TABLE OF CONTENTS
1 Introduction
- 1.1 Study Assumptions and Market Definition
- 1.2 Scope of the Study
2 Research Methodology
3 Executive Summary
4 Market Landscape
- 4.1 Market Overview
- 4.2 Market Drivers
- 4.2.1 Growing demand for premium skin-care actives
- 4.2.2 Expansion of middle-class spending in Asia-Pacific
- 4.2.3 Shift toward natural and sustainable ingredients
- 4.2.4 E-commerce acceleration of niche beauty brands
- 4.2.5 AI-driven formulation platforms shorten research and development cycles
- 4.3 Market Restraints
- 4.3.1 Strict bans on micro-plastics and certain preservatives
- 4.3.2 Volatile petro-derivative costs
- 4.3.3 Water-scarcity limits for rinse-off formulations
- 4.4 Value Chain Analysis
- 4.5 Porter's Five Forces
- 4.5.1 Bargaining Power of Suppliers
- 4.5.2 Bargaining Power of Consumers
- 4.5.3 Threat of New Entrants
- 4.5.4 Threat of Substitutes
- 4.5.5 Degree of Competition
5 Market Size and Growth Forecasts (Value)
- 5.1 By Ingredient
- 5.1.1 Inactive Ingredients
- 5.1.1.1 Surfactants
- 5.1.1.2 Emulsifiers
- 5.1.1.3 Emollients
- 5.1.1.4 Colorants and Preservatives
- 5.1.1.5 Rheology Control Agents
- 5.1.1.6 Other Inactive Ingredients
- 5.1.2 Active Ingredients
- 5.1.2.1 Conditioning Agents
- 5.1.2.2 UV Ingredients
- 5.1.2.3 Anti-ageing Agents
- 5.1.2.4 Exfoliants
- 5.1.2.5 Other Active Ingredients
- 5.1.1 Inactive Ingredients
- 5.2 By Application
- 5.2.1 Skin Care
- 5.2.2 Hair Care
- 5.2.3 Make-up
- 5.2.4 Fragrances
- 5.2.5 Oral Care
- 5.2.6 Toiletries
- 5.3 By Geography
- 5.3.1 Asia-Pacific
- 5.3.1.1 China
- 5.3.1.2 India
- 5.3.1.3 Japan
- 5.3.1.4 South Korea
- 5.3.1.5 ASEAN Countries
- 5.3.1.6 Rest of Asia-Pacific
- 5.3.2 North America
- 5.3.2.1 United States
- 5.3.2.2 Canada
- 5.3.2.3 Mexico
- 5.3.3 Europe
- 5.3.3.1 Germany
- 5.3.3.2 United Kingdom
- 5.3.3.3 France
- 5.3.3.4 Spain
- 5.3.3.5 Italy
- 5.3.3.6 NORDICS Countries
- 5.3.3.7 Rest of Europe
- 5.3.4 South America
- 5.3.4.1 Brazil
- 5.3.4.2 Argentina
- 5.3.4.3 Rest of South America
- 5.3.5 Middle-East and Africa
- 5.3.5.1 Saudi Arabia
- 5.3.5.2 South Africa
- 5.3.5.3 Rest of Middle-East and Africa
- 5.3.1 Asia-Pacific
6 Competitive Landscape
- 6.1 Market Concentration
- 6.2 Strategic Moves
- 6.3 Market Share (%)/Ranking Analysis
- 6.4 Company Profiles (includes Global level Overview, Market level overview, Core Segments, Financials as available, Strategic Information, Market Rank/Share for key companies, Products and Services, and Recent Developments)
- 6.4.1 Ashland
- 6.4.2 BASF
- 6.4.3 Clariant
- 6.4.4 Croda International Plc
- 6.4.5 Dow
- 6.4.6 DSM
- 6.4.7 Evonik Industries AG
- 6.4.8 GALAXY
- 6.4.9 Innospec
- 6.4.10 Kao Corporation
- 6.4.11 Lonza
- 6.4.12 Merck KGaA
- 6.4.13 Momentive
- 6.4.14 Nouryon
- 6.4.15 Sasol
- 6.4.16 Solvay
- 6.4.17 Stepan Company
- 6.4.18 Symrise
- 6.4.19 The Lubrizol Corporation
- 6.4.20 Wacker Chemie AG
7 Market Opportunities and Future Outlook
- 7.1 White-space and Unmet-Need Assessment

