
PUBLISHER: Mordor Intelligence | PRODUCT CODE: 1910621

PUBLISHER: Mordor Intelligence | PRODUCT CODE: 1910621
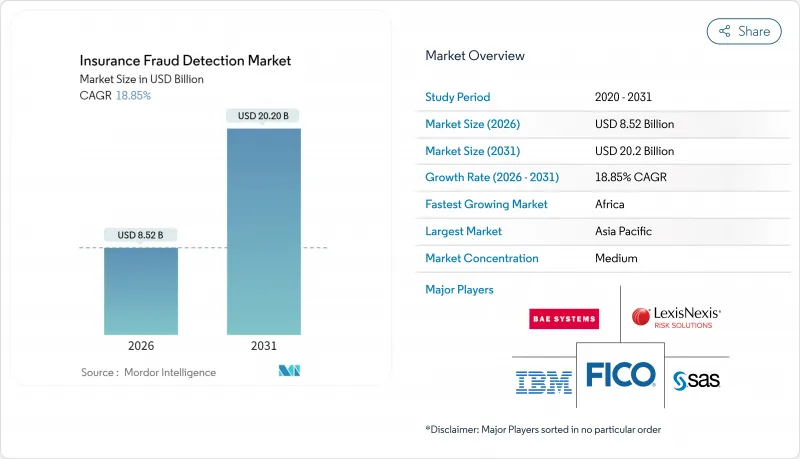
Insurance Fraud Detection - Market Share Analysis, Industry Trends & Statistics, Growth Forecasts (2026 - 2031)
The insurance fraud detection market was valued at USD 7.17 billion in 2025 and estimated to grow from USD 8.52 billion in 2026 to reach USD 20.2 billion by 2031, at a CAGR of 18.85% during the forecast period (2026-2031).
Real-time analytics, AI-powered claims automation, and cloud-native deployments are the principal forces widening adoption curves. Tier-1 carriers now process millions of transactions per second, and regulators are imposing stiffer civil penalties that make manual workflows cost-prohibitive. Asia Pacific is setting the innovation pace through mobile-first insurance models, while North America is scaling sophisticated behavioral analytics that marry telematics and identity management. Competitive intensity is shifting from point-solution accuracy to seamless ecosystem integration, enabling smaller SaaS vendors to win share from entrenched mainframe providers.
Global Insurance Fraud Detection Market Trends and Insights
Need to Effectively Manage Exploding Digital Identities
Synthetic identities are proliferating and pressuring carriers to tighten front-end verification protocols. Consumers interact with insurers through 15-20 digital touchpoints, each a potential doorway for fraudulent personas. LexisNexis Risk Solutions bolstered its toolkit by acquiring IDVerse in February 2025, adding deepfake detection that validates identity documents with 99.7% accuracy. Carriers now fuse device intelligence, biometric signals, and behavioral analytics to map a single customer across disparate channels, closing loopholes exploited by fraud rings.
Surge in AI-Powered Claims Automation Among Tier-1 Insurers
Leading insurers have trimmed manual reviews by up to 85% without sacrificing detection accuracy. Fair Isaac Corporation reported a 31% jump in platform recurring revenue during Q4 2024, driven largely by AI-centric deployments across 140 tier-one financial institutions. Natural language processing and computer vision analyze adjuster notes, photos, and video feeds in seconds, flagging staged accidents and inflated invoices before payments leave the door.
High False-Positive Rates Eroding Adjuster Productivity
Some AI models flag legitimate claims in more than 30% of cases, overwhelming human reviewers and extending settlement cycles. Carriers must strike a balance between sensitivity and specificity; yet achieving <15% false positives while keeping accuracy above 85% remains difficult. Firms are layering ensemble models that cascade simple rules, supervised learning, and network analytics to reduce noise without diluting fraud catch rates.
Other drivers and restraints analyzed in the detailed report include:
- Rising Regulatory Penalties for Fraudulent Payouts
- Growth of Usage-Based Insurance and IoT Telematics Data
- Budget Constraints at Mid-Tier Carriers
For complete list of drivers and restraints, kindly check the Table Of Contents.
Segment Analysis
Solutions accounted for 72.64% of the insurance fraud detection market share in 2025, reflecting the industry's continued reliance on end-to-end platforms that combine data ingestion, real-time scoring, and case management. Services, however, are expanding at a 19.05% CAGR as carriers outsource model tuning, regulatory reporting, and third-party data orchestration. This shift indicates growing recognition that AI models require continual calibration to track emerging fraud patterns and regional rule changes. Vendors now include managed services in subscription bundles, ensuring algorithms remain current without burdening internal data-science teams.
Managed-service contracts typically cover consortium-data onboarding, model explainability testing, and periodic bias audits, all of which strengthen platform stickiness. Cloud-native specialists bundle integration expertise that connects fraud engines to claims, policy, and billing cores in less than eight weeks. Large carriers also tap services teams for custom feature engineering, while mid-tiers lean on out-of-the-box templates to close the capability gap. The insurance fraud detection market size tied to services therefore mirrors a strategic migration from one-time software sales to recurring outcome-based engagements.
Payment and billing fraud dominated with 38.10% of the insurance fraud detection market size in 2025, driven by the surge in digital premium collections and automated payouts. Money laundering detection is the fastest-growing application, posting a 20.78% CAGR as regulators press insurers to monitor multi-jurisdictional flows that extend beyond traditional banking channels. Claims fraud and identity theft continue steady growth, supported by image-forensics modules that flag recycled photos and manipulated metadata.
Graph analytics now map layered transfers across apparently unrelated policies, exposing shell-company networks that funnel illicit funds. AI engines score more than 500 attributes per transaction, blending device fingerprints, geolocation shifts, and crypto-wallet traces. Carriers integrating blockchain analytics report a 35% reduction in investigative cycle times compared with legacy rules. As digital wallets and real-time payments proliferate, platform vendors prioritize cross-product correlation to intercept complex schemes that span life, health, and P&C lines within the broader insurance fraud detection market.
The Insurance Fraud Detection Market Report is Segmented by Component (Solution, and Service), Application (Claims Fraud, Identity Theft, Payment and Billing Fraud, and More), Deployment Mode (On-Premise, and Cloud), End-User Industry (Automotive, BFSI, Healthcare, Retail, and More), Organization Size (Large Enterprises, and Small and Medium Enterprises), and Geography. The Market Forecasts are Provided in Terms of Value (USD).
Geography Analysis
Asia Pacific dominated with 33.25% share in 2025, anchored by mobile-first products and national digital-ID frameworks that streamline verification. China and India integrate social-credit scores and biometric checks, generating granular behavioral datasets that sharpen fraud-risk segmentation. Start-ups in Indonesia and Vietnam tailor edge-computing models that work offline, a necessity in rural zones with intermittent connectivity. Carriers in Japan pilot embedded insurance for smart-home devices, harvesting sensor data to pre-empt fraudulent water-damage claims.
Africa is the fastest-growing region at 21.05% CAGR. Mobile money insurance dominates distribution, and identity fraud rose 400% across key markets in 2024. Edge-deployed ML models assess fraud in under 0.3 seconds on low-power devices, an innovation now being reverse-exported to European rural insurers. Regional regulators mandate end-to-end encryption for claim data, spurring local vendors to build lightweight cryptographic libraries that align with constrained bandwidth realities.
North America combines strict regulatory oversight with pioneering adoption of behavioral biometrics. Insurers integrate sensory data from advanced driver-assistance systems to flag orchestrated accidents. Data-localization in Canada pushes hybrid deployments, while U.S. carriers leverage consortium repositories to cross-check claimant histories. Europe focuses on GDPR-compliant AI, leading to privacy-preserving techniques such as federated learning that train fraud models without raw data exchange. Digital-identity wallets under eIDAS 2.0 will soon allow pan-European claim authentication, creating new vectors for the insurance fraud detection market to standardize cross-border workflows.
- Cognex Corporation
- Keyence Corporation
- Omron Corporation
- Teledyne Technologies Incorporated
- Sony Group Corporation
- Atlas Copco AB (ISRA Vision)
- IDS Imaging Development Systems GmbH
- National Instruments Corporation
- MVTec Software GmbH
- Basler AG
- Allied Vision Technologies GmbH
- TKH Group NV (LMI Technologies)
- FLIR Systems Inc (Teledyne)
- Intel Corporation
- Qualcomm Technologies Inc
- Sick AG
- Panasonic Holdings Corporation
- Stemmer Imaging AG
- Zebra Technologies Corporation
- Hitachi Ltd.
Additional Benefits:
- The market estimate (ME) sheet in Excel format
- 3 months of analyst support
TABLE OF CONTENTS
1 INTRODUCTION
- 1.1 Study Assumptions and Market Definition
- 1.2 Scope of the Study
2 RESEARCH METHODOLOGY
3 EXECUTIVE SUMMARY
4 MARKET LANDSCAPE
- 4.1 Market Overview
- 4.2 Market Drivers
- 4.2.1 Rising Need for Zero-Defect Manufacturing
- 4.2.2 Increasing Adoption of Vision-Guided Robotics
- 4.2.3 Growing Demand for 3D Vision in Electronics Miniaturisation
- 4.2.4 Stringent Quality Rules for Food and Pharmaceuticals
- 4.2.5 Surge in On-Device AI Inference Chips
- 4.2.6 Emergence of Vision-as-a-Service Subscription Models
- 4.3 Market Restraints
- 4.3.1 Lack of Skilled Machine Vision Integrators
- 4.3.2 High Cost of High-Resolution and Hyperspectral Cameras
- 4.3.3 Cybersecurity Risks in Cloud-Connected Vision Systems
- 4.3.4 Supply Chain Volatility of Image Sensor Semiconductors
- 4.4 Industry Ecosystem Analysis
- 4.5 Impact of Macroeconomic Factors
- 4.6 Regulatory Landscape
- 4.7 Technological Outlook
- 4.8 Porter's Five Forces Analysis
- 4.8.1 Bargaining Power of Suppliers
- 4.8.2 Bargaining Power of Buyers
- 4.8.3 Threat of New Entrants
- 4.8.4 Threat of Substitutes
- 4.8.5 Intensity of Competitive Rivalry
5 MARKET SIZE AND GROWTH FORECASTS (VALUE)
- 5.1 By Component
- 5.1.1 Hardware
- 5.1.1.1 Vision Systems
- 5.1.1.2 Cameras
- 5.1.1.3 Optics and Illumination Systems
- 5.1.1.4 Frame Grabbers
- 5.1.1.5 Other Hardwares
- 5.1.2 Software
- 5.1.1 Hardware
- 5.2 By Product Type
- 5.2.1 PC-Based
- 5.2.2 Smart Camera-Based
- 5.3 By Imaging Type
- 5.3.1 2D Imaging
- 5.3.2 3D Imaging
- 5.3.3 Hyperspectral and Multispectral Imaging
- 5.4 By End-User Industry
- 5.4.1 Automotive
- 5.4.2 Electronics and Semiconductors
- 5.4.3 Food and Beverage
- 5.4.4 Healthcare and Pharmaceutical
- 5.4.5 Logistics and Retail
- 5.4.6 Other End-User Industries
- 5.5 By Deployment Mode
- 5.5.1 On-Premise
- 5.5.2 Edge/Embedded
- 5.5.3 Cloud-Based
- 5.6 By Geography
- 5.6.1 North America
- 5.6.1.1 United States
- 5.6.1.2 Canada
- 5.6.1.3 Mexico
- 5.6.2 South America
- 5.6.2.1 Brazil
- 5.6.2.2 Argentina
- 5.6.2.3 Chile
- 5.6.2.4 Rest of South America
- 5.6.3 Europe
- 5.6.3.1 United Kingdom
- 5.6.3.2 Germany
- 5.6.3.3 France
- 5.6.3.4 Italy
- 5.6.3.5 Spain
- 5.6.3.6 Russia
- 5.6.3.7 Netherlands
- 5.6.3.8 Rest of Europe
- 5.6.4 Asia Pacific
- 5.6.4.1 China
- 5.6.4.2 Japan
- 5.6.4.3 India
- 5.6.4.4 South Korea
- 5.6.4.5 Australia
- 5.6.4.6 Rest of Asia Pacific
- 5.6.5 Middle East
- 5.6.5.1 Gulf Cooperation Council
- 5.6.5.2 Turkey
- 5.6.5.3 Israel
- 5.6.5.4 Rest of Middle East
- 5.6.6 Africa
- 5.6.6.1 South Africa
- 5.6.6.2 Nigeria
- 5.6.6.3 Kenya
- 5.6.6.4 Egypt
- 5.6.6.5 Rest of Africa
- 5.6.1 North America
6 COMPETITIVE LANDSCAPE
- 6.1 Market Concentration
- 6.2 Strategic Moves
- 6.3 Market Share Analysis
- 6.4 Company Profiles (includes Global level Overview, Market level overview, Core Segments, Financials as available, Strategic Information, Market Rank/Share for key companies, Products and Services, and Recent Developments)
- 6.4.1 Cognex Corporation
- 6.4.2 Keyence Corporation
- 6.4.3 Omron Corporation
- 6.4.4 Teledyne Technologies Incorporated
- 6.4.5 Sony Group Corporation
- 6.4.6 Atlas Copco AB (ISRA Vision)
- 6.4.7 IDS Imaging Development Systems GmbH
- 6.4.8 National Instruments Corporation
- 6.4.9 MVTec Software GmbH
- 6.4.10 Basler AG
- 6.4.11 Allied Vision Technologies GmbH
- 6.4.12 TKH Group NV (LMI Technologies)
- 6.4.13 FLIR Systems Inc (Teledyne)
- 6.4.14 Intel Corporation
- 6.4.15 Qualcomm Technologies Inc
- 6.4.16 Sick AG
- 6.4.17 Panasonic Holdings Corporation
- 6.4.18 Stemmer Imaging AG
- 6.4.19 Zebra Technologies Corporation
- 6.4.20 Hitachi Ltd.
7 MARKET OPPORTUNITIES AND FUTURE OUTLOOK
- 7.1 White-Space and Unmet-Need Assessment

