
PUBLISHER: Mordor Intelligence | PRODUCT CODE: 1910626

PUBLISHER: Mordor Intelligence | PRODUCT CODE: 1910626
Functional Safety - Market Share Analysis, Industry Trends & Statistics, Growth Forecasts (2026 - 2031)
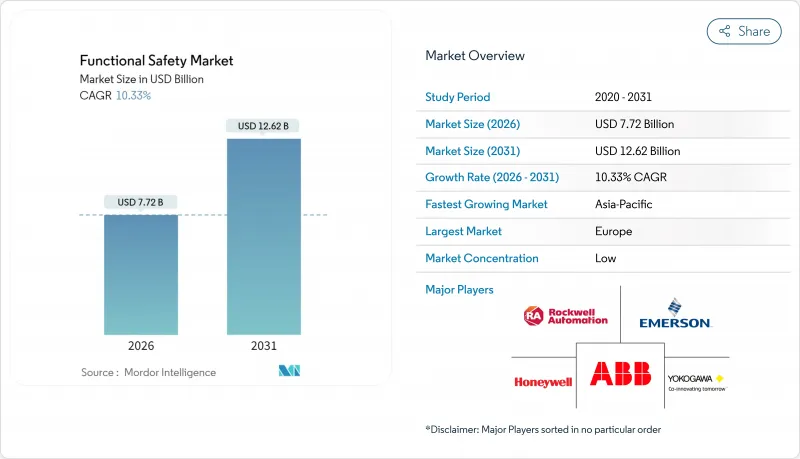
Functional Safety market size in 2026 is estimated at USD 7.72 billion, growing from 2025 value of USD 7.00 billion with 2031 projections showing USD 12.62 billion, growing at 10.33% CAGR over 2026-2031.
Solid demand arises from the way stricter global standards now intersect with Industry 4.0 roll-outs, forcing manufacturers to embed safety functions into core automation platforms from the concept stage. Heightened regulatory enforcement following incident investigations in oil, gas, and power facilities further boosts adoption, while rapid digitalization creates use cases that favor programmable safety logic over hard-wired relays. Vendors also benefit from the need to merge functional safety with enterprise cybersecurity, a trend reinforced by ISA/IEC 62443 guidelines that treat process safety and cyber resilience as two halves of the same discipline. As a result, solution providers that can validate SIL compliance and cyber-secure design in one offering win a clear competitive edge.
Global Functional Safety Market Trends and Insights
Stringent Global Safety Regulations and Standards
IEC 61508 now anchors product approvals across sectors, and the 2024 ISO 26262 update adds explicit AI and machine-learning guidance, forcing design-stage safety integration. Manufacturers seeking global market entry therefore require SIL-rated components and system-level validation, which sustains predictable demand for accredited testing laboratories. At the same time, the EU Machinery Directive, OSHA directives, and comparable rules in Japan and China have raised enforcement intensity. Coupled with rising penalties for non-compliance, these frameworks motivate enterprises to replace standalone relays with integrated, certificate-backed safety controllers to simplify audits and speed plant approvals.
Industry 4.0 Expansion Accelerates Safety System Integration
Digital transformation places operational data in the cloud, so safety functions must now talk natively to Ethernet-based networks while maintaining deterministic response times. Smart factories use digital twins for predictive shutdowns, and AI analytics spot sensor drift before it threatens SIL targets. Such use cases favor programmable logic that can accept multiple protocols and push diagnostics upstream to MES and ERP layers. Demand therefore tilts toward flexible safety PLCs and software frameworks that can be patched remotely without losing certification status.
High Implementation Costs Challenge SME Adoption
Obtaining SIL 3 certification can add 15-25% to total project budgets because of rigorous third-party testing and documentation. Many SMEs defer upgrades or select lower SIL targets, slowing penetration in light industry and discrete manufacturing. While subscription models help, capital intensity remains the leading brake on near-term growth, especially where local enforcement is still maturing.
Other drivers and restraints analyzed in the detailed report include:
- Incident-Driven Scrutiny in Oil, Gas, and Power
- Integration of Functional Safety with Industrial Cybersecurity
- Brown-Field Retrofitting Presents Complex Integration Challenges
For complete list of drivers and restraints, kindly check the Table Of Contents.
Segment Analysis
Revenue from safety sensors accounted for the largest 27.62% share of the functional safety market size in 2025, reflecting their role as the primary link between physical hazards and control systems. Continuous improvements in optical resolution and self-diagnostics increase sensor reliability, letting manufacturers raise proof-test intervals and cut downtime. Adoption also rises in clean-room and food-grade environments where non-contact sensing minimizes contamination risk.
Demand for programmable safety systems is forecast to post an 11.05% CAGR through 2031, the fastest rate among device categories. As Industry 4.0 spreads, users favor software-configurable logic that can adapt to frequent product changeovers without rewiring cabinets. Platforms such as Omron's Sysmac Studio cut programming time by 90%, easing the certified-engineer bottleneck. Final control elements, valves, actuators, and drives, also gain momentum because process industries are replacing aging mechanical governors with SIL-rated digital devices that support condition monitoring. Over the forecast horizon, integrated sensor-controller packages that streamline validation are likely to shift spend away from discrete components toward bundled solutions, reinforcing the trend toward platform providers.
Emergency shutdown (ESD) systems represented 23.55% of the functional safety market share in 2025, anchored in oil, gas, and chemical operations that need rapid isolation during process upsets. Market density is highest on offshore platforms and LNG trains where high-value assets and stricter codes compel multi-layered protection. Vendors continue to enhance diagnostics and voting architectures to meet SIL 3 with fewer I/O points, lowering lifecycle cost.
High-integrity pressure protection systems (HIPPS) are projected to grow at a 10.95% CAGR as deep-water projects adopt them to avoid oversized flare stacks and reduce emissions. Successful deployments on North Sea assets delivered USD 25 million in CAPEX savings, creating a robust ROI case. Burner management and turbomachinery controls maintain steady demand in power and refining, while fire-and-gas systems receive a boost from regulations mandating full coverage models that integrate flame, toxic gas, and heat detection into one analytics dashboard.
The Functional Safety Market Report is Segmented by Device Type (Safety Sensors, Safety Controllers/Modules/Relays, and More), Safety Systems (BMS, TMC, HIPPS, and More), Services (TIC, Design/Engineering/Maintenance, and More), End-User Industry (Oil and Gas, Power Generation, and More), and Geography. The Market Forecasts are Provided in Terms of Value (USD).
Geography Analysis
Europe retained the lead with 28.40% functional safety market share in 2025, underpinned by the EU Machinery Directive and widespread use of advanced automation in Germany, Italy, and the Nordic states. Adoption intensifies in renewable energy and offshore wind, where high-value assets and remote locations demand SIL 3-compliant shutdown devices capable of remote diagnostics.
North America follows closely, supported by OSHA-driven worker-safety programs and extensive refining, petrochemical, and pharmaceutical capacity. The region also pioneers safety-cybersecurity convergence, helped by mature IT-OT integration skills and a deep bench of certified engineers. Federal stimulus for semiconductor fabs reinforces new installations of programmable safety platforms that meet both IEC 61508 and ISA/IEC 62443 requirements.
Asia-Pacific is poised for the fastest 11.25% CAGR to 2031. China's ongoing manufacturing upgrade, alongside Japan's precision robotics investments, spurs heavy purchases of programmable safety PLCs and smart light curtains. Southeast Asian nations adopt subscription-based safety services to meet rising workplace safety expectations without heavy CAPEX, while India's new chemical-process safety guidelines bring green-field plants straight to SIL 2-plus specification levels. Middle East and Africa contribute incremental gains as NOC and IOC projects in Saudi Arabia, Qatar, and the UAE standardize HIPPS and advanced fire-and-gas detection on green-field LNG and hydrogen facilities.
- Rockwell Automation Inc.
- Emerson Electric Company
- Honeywell International Inc.
- ABB Ltd
- Yokogawa Electric Corporation
- Schneider Electric SE
- Siemens AG
- General Electric Company
- Omron Corporation
- SICK AG
- Panasonic Corporation
- Pepperl+Fuchs SE
- Banner Engineering Corporation
- Pilz GmbH and Co. KG
- HIMA Paul Hildebrandt GmbH
- Mitsubishi Electric Corporation
- Phoenix Contact GmbH and Co. KG
- Turck GmbH and Co. KG
- Balluff GmbH
- IDEC Corporation
Additional Benefits:
- The market estimate (ME) sheet in Excel format
- 3 months of analyst support
TABLE OF CONTENTS
1 INTRODUCTION
- 1.1 Study Assumptions and Market Definition
- 1.2 Scope of the Study
2 RESEARCH METHODOLOGY
3 EXECUTIVE SUMMARY
4 MARKET LANDSCAPE
- 4.1 Market Overview
- 4.2 Market Drivers
- 4.2.1 Stringent global safety regulations and standards (IEC 61508, ISO 26262)
- 4.2.2 Expansion of Industry 4.0 and industrial automation
- 4.2.3 Heightened incident?related scrutiny in Oil and gas, and power sectors
- 4.2.4 Integration of functional safety with industrial cybersecurity
- 4.2.5 Emergence of SIL-certified AI/ML shutdown algorithms
- 4.2.6 Rise of Safety-as-a-Service subscription models for SMEs
- 4.3 Market Restraints
- 4.3.1 High upfront cost of SIL-certified components and systems
- 4.3.2 Complexity of retrofitting legacy brown-field facilities
- 4.3.3 Shortage of certified functional safety engineers
- 4.3.4 Liability ambiguity for OTA safety-critical software updates
- 4.4 Industry Value Chain Analysis
- 4.5 Regulatory Landscape
- 4.6 Technological Outlook
- 4.7 Porter's Five Forces Analysis
- 4.7.1 Bargaining Power of Suppliers
- 4.7.2 Bargaining Power of Buyers
- 4.7.3 Threat of New Entrants
- 4.7.4 Threat of Substitutes
- 4.7.5 Intensity of Competitive Rivalry
- 4.8 Assessment of Macro-economic Trends on the Market
5 MARKET SIZE AND GROWTH FORECASTS (VALUES)
- 5.1 By Device Type
- 5.1.1 Safety Sensors
- 5.1.2 Safety Controllers/Modules/Relays
- 5.1.3 Safety Switches
- 5.1.4 Programmable Safety Systems
- 5.1.5 Emergency Stop Devices
- 5.1.6 Final Control Elements (Valves, Actuators)
- 5.1.7 Other Device Types
- 5.2 By Safety Systems
- 5.2.1 Burner Management Systems (BMS)
- 5.2.2 Turbomachinery Control (TMC) Systems
- 5.2.3 High-Integrity Pressure Protection Systems (HIPPS)
- 5.2.4 Fire and Gas Monitoring Control Systems
- 5.2.5 Emergency Shutdown Systems (ESD)
- 5.2.6 Supervisory Control and Data Acquisition (SCADA) Systems
- 5.2.7 Distributed Control Systems (DCS)
- 5.3 By Services
- 5.3.1 Testing, Inspection and Certification
- 5.3.2 Design, Engineering and Maintenance
- 5.3.3 Training and Consulting Services
- 5.4 By End-user Industry
- 5.4.1 Oil and Gas
- 5.4.2 Power Generation
- 5.4.3 Food and Beverage
- 5.4.4 Pharmaceutical
- 5.4.5 Automotive
- 5.4.6 Other End-user Industries
- 5.5 By Geography
- 5.5.1 North America
- 5.5.1.1 United States
- 5.5.1.2 Canada
- 5.5.1.3 Mexico
- 5.5.2 South America
- 5.5.2.1 Brazil
- 5.5.2.2 Argentina
- 5.5.2.3 Rest of South America
- 5.5.3 Europe
- 5.5.3.1 Germany
- 5.5.3.2 United Kingdom
- 5.5.3.3 France
- 5.5.3.4 Italy
- 5.5.3.5 Spain
- 5.5.3.6 Rest of Europe
- 5.5.4 Asia-Pacific
- 5.5.4.1 China
- 5.5.4.2 Japan
- 5.5.4.3 India
- 5.5.4.4 South Korea
- 5.5.4.5 Singapore
- 5.5.4.6 Australia
- 5.5.4.7 Malaysia
- 5.5.4.8 Rest of Asia-Pacific
- 5.5.5 Middle East and Africa
- 5.5.5.1 Middle East
- 5.5.5.1.1 Saudi Arabia
- 5.5.5.1.2 United Arab Emirates
- 5.5.5.1.3 Rest of Middle East
- 5.5.5.2 Africa
- 5.5.5.2.1 South Africa
- 5.5.5.2.2 Egypt
- 5.5.5.2.3 Rest of Africa
- 5.5.5.1 Middle East
- 5.5.1 North America
6 COMPETITIVE LANDSCAPE
- 6.1 Market Concentration
- 6.2 Strategic Moves
- 6.3 Market Share Analysis
- 6.4 Company Profiles (includes Global level Overview, Market level overview, Core Segments, Financials as available, Strategic Information, Market Rank/Share for key companies, Products and Services, and Recent Developments)
- 6.4.1 Rockwell Automation Inc.
- 6.4.2 Emerson Electric Company
- 6.4.3 Honeywell International Inc.
- 6.4.4 ABB Ltd
- 6.4.5 Yokogawa Electric Corporation
- 6.4.6 Schneider Electric SE
- 6.4.7 Siemens AG
- 6.4.8 General Electric Company
- 6.4.9 Omron Corporation
- 6.4.10 SICK AG
- 6.4.11 Panasonic Corporation
- 6.4.12 Pepperl+Fuchs SE
- 6.4.13 Banner Engineering Corporation
- 6.4.14 Pilz GmbH and Co. KG
- 6.4.15 HIMA Paul Hildebrandt GmbH
- 6.4.16 Mitsubishi Electric Corporation
- 6.4.17 Phoenix Contact GmbH and Co. KG
- 6.4.18 Turck GmbH and Co. KG
- 6.4.19 Balluff GmbH
- 6.4.20 IDEC Corporation
7 MARKET OPPORTUNITIES AND FUTURE OUTLOOK
- 7.1 White-Space and Unmet-Need Assessment

