
PUBLISHER: Mordor Intelligence | PRODUCT CODE: 1910641

PUBLISHER: Mordor Intelligence | PRODUCT CODE: 1910641
Engineering Services - Market Share Analysis, Industry Trends & Statistics, Growth Forecasts (2026 - 2031)
The engineering services market size in 2026 is estimated at USD 1.81 trillion, growing from 2025 value of USD 1.74 trillion with 2031 projections showing USD 2.22 trillion, growing at 4.16% CAGR over 2026-2031.
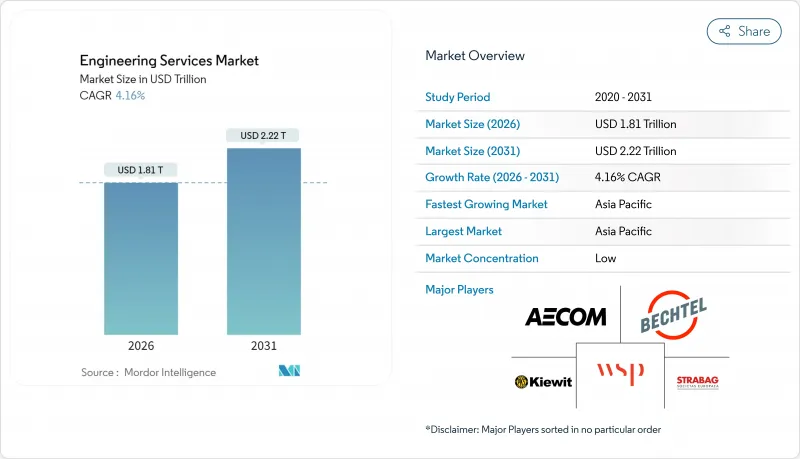
Rising public-sector infrastructure programs, private capital pouring into energy-transition assets, and accelerating digital-twin adoption are the primary vectors supporting that expansion. Civil and electrical disciplines jointly underpin most contracts, while hybrid onsite, offshore delivery helps vendors balance project complexity with cost optimization. Mid-sized firms continue to gain share by specializing in hydrogen, carbon-capture, and small modular reactor (SMR) work, where government incentives strengthen demand visibility. Asia Pacific sustains the largest regional opportunity set, yet North America posts resilient growth as federal clean-energy funds flow into grid-modernization and defense programs.
Global Engineering Services Market Trends and Insights
Evolution of Industrial IoT and Digital-Twin Adoption
Manufacturers are scaling digital twins to cut downtime and fine-tune asset utilization, triggering premium demand for multidisciplinary engineering support. Engagements commonly promise 15-25% cost reductions once predictive maintenance stabilizes operations. Vendors that couple mechanical strength with analytics talent win higher bill rates, yet the scarcity of such hybrid skills keeps margins firm. As operational-technology networks connect to enterprise IT, cyber-hardening design has become a mandatory scope element, further widening project value and complexity. The trend is most visible in semiconductor fabs, battery-cell plants, and offshore production platforms, where tolerance for unplanned outages is minimal. Over the medium term, cross-domain expertise will define competitive advantage, giving specialist firms room to outpace generalists.
Rapid Urbanization Spurring Civil-Infrastructure Demand
Global cities require USD 9 trillion annually through 2025 to relieve congestion and climate stress. Asia's 2.3% yearly urban-population increment forces record spending on mass-transit corridors, flood-control systems, and smart-utility grids. Engineering consultancies help municipalities structure bankable public-private partnership (PPP) deals, a capability that attracts institutional capital. In the United States, federal water infrastructure grants alone create a USD 6 billion annual engineering opportunity. Environmental-compliance mandates, particularly for wastewater and storm-resilience projects, lengthen scoping phases and raise demand for experienced civil firms. Long-term growth, therefore, remains anchored in the intersection of urban build-out needs and stricter sustainability codes.
Political Instability and Acute Skilled-Labor Shortage
Cross-border project risk premiums widen in politically volatile regions, inflating insurance costs and elongating approval cycles. Concurrently, retirements reduce the available experienced-engineer pool just as demand peaks. Firms report up to 40% vacancy rates for critical cyber-physical roles, forcing salary premiums of 25-35%. Over-reliance on subcontractors erodes margin and invites quality scrutiny, while visa and certification bottlenecks limit rapid redeployment of personnel. Companies now invest in internal academies and international rotation programs to stabilize workforce pipelines, but near-term capacity constraints remain a drag on market velocity.
Other drivers and restraints analyzed in the detailed report include:
- Accelerated Product Life-Cycle Driving Outsourced Research and Development
- Energy-Transition Mega-Projects Requiring EPCM Expertise
- IP-Security Concerns Limiting Defense Outsourcing
For complete list of drivers and restraints, kindly check the Table Of Contents.
Segment Analysis
Civil engineering retained 37.86% of 2025 revenue as governments continued to prioritize transportation corridors and resilient water systems. Electrical work, however, is forecast to grow at a 4.93% CAGR, the fastest among disciplines, propelled by USD 369 billion in U.S. clean-energy incentives and parallel EU Green Deal funding. Mechanical services gain traction through factory automation and robotics retrofits, while structural and piping segments trace the broader construction cycle. Electrical practitioners increasingly bundle software coding, cybersecurity, and IEC-61850 grid-protocol expertise with traditional design scopes, a convergence that maintains high average selling prices. As distributed energy resources proliferate, utilities award multi-year frameworks covering substation digitalization and storage-integration studies. These developments keep the engineering services market on an electrification-tilted growth arc.
The blurring of disciplinary boundaries also reshapes talent strategies; firms now recruit data scientists alongside PE-licensed engineers to satisfy digital-twin deliverables. Certification regimes such as IEEE and ISO-55000 factor heavily into bid evaluations, elevating firms with proven compliance track records. Consequently, premium billing rates remain sticky even in price-sensitive emerging markets. By 2031, electrical contracts are expected to approach civil's revenue scale, tightening competition and prompting niche specialization, such as vehicle-to-grid systems and high-voltage direct-current interconnects, to preserve differentiation.
On-site work held a 66.83% share in 2025 due to the need for face-to-face coordination on regulated projects, yet offshore execution is expanding at a 5.05% CAGR. Cloud-native CAD/CAM platforms enable 24-hour design cycles by handing deliverables to centers in India, the Philippines, and Eastern Europe. Cost arbitrage of 40-60% versus local teams remains compelling for routine drafting, freeing onsite staff for stakeholder management and field supervision. The engineering services market increasingly coalesces around hybrid statements of work that specify deliverables, not headcount, thereby defusing earlier client concerns about remote quality control.
Vendor selection now pivots on cybersecurity posture and data-segmentation capabilities rather than solely on hourly rates. ISO-27001 and SOC-2 attestations have become table stakes. For government-sensitive scopes, clients sometimes carve out clean-room offshore pods staffed exclusively by citizens of allied nations to comply with export-control regulations. With automation in documentation and model-checking advancing, firms expect incremental margin lift from productivity gains, even as daily rates for senior architects remain flat. The trend confirms offshore's evolution from tactical cost lever to strategic resource multiplier.
The Engineering Services Market Report is Segmented by Engineering Disciplines (Civil, Mechanical, and More), Delivery Model (Offshore, and Onsite), Services (Product Engineering, Process Engineering, and More), End-User Industry (Aerospace and Defense, Automotive, and More), and Geography (North America, South America, Europe, Asia-Pacific, and Middle East and Africa). The Market Forecasts are Provided in Terms of Value (USD).
Geography Analysis
Asia Pacific retained 39.52% of 2025 revenue, anchored by USD 1.7 trillion in annual infrastructure spending. China's Belt and Road initiatives and India's mass rapid-transit build-outs secure a robust civil-work backlog, while Asia-Pacific manufacturing-reshoring funnels orders into factory-automation and utility-grid upgrades. Regional governments allocate climate-adaptation grants toward coastal-protection engineering, propelling coastal-civil sub-disciplines. As a result, the engineering services market registers its fastest 5.13% regional CAGR here, sustained by sovereign wealth deployment into mega-projects.
North America holds the second-largest share, buoyed by USD 369 billion in U.S. clean-energy incentives and USD 1.2 trillion for broader infrastructure modernization. Defense spending and SMR pilots further sharpen demand for high-clearance engineering talent. Canada's LNG and nuclear programs, along with Mexico's near-shoring-induced factory builds, enlarge the continental project funnel. Vendor opportunities span grid-interconnect studies, hydrogen-hub FEED contracts, and critical-mineral processing plants.
Europe pivots on net-zero retrofits and offshore-wind expansion financed by the EU Green Deal.Germany's EUR 500 billion (USD 550 billion) infrastructure fund and the U.K.'s Sizewell C nuclear project typify large pipeline items. Strict taxonomy rules steer capital toward certified sustainable projects, rewarding firms adept at ESG reporting. Meanwhile, the Middle East and Africa focus on energy diversification, such as green-ammonia export hubs in the Gulf and utility-scale solar in North Africa. Political stability issues and labor shortages, however, temper growth velocity in selected Middle East and Africa markets.
- AECOM Engineering company
- Bechtel Corporation
- Kiewit Corporation
- WSP Global Inc.
- STRABAG SE
- Fluor Corporation
- Tetra Tech, Inc.
- Arcadis NV
- Stantec Inc.
- AtkinsRealis Inc.
- NV5 Global, Inc.
- Black & Veatch Holding Co.
- Balfour Beatty plc
- HDR, Inc.
- Wood PLC
- China Communications Construction Co. Ltd.
- Gilbane Building Company
- Brasfield & Gorrie LLC
- Jacobs Solutions Inc.
- Barton Malow Inc.
Additional Benefits:
- The market estimate (ME) sheet in Excel format
- 3 months of analyst support
TABLE OF CONTENTS
1 INTRODUCTION
- 1.1 Study Assumptions and Market Definition
- 1.2 Scope of the Study
2 RESEARCH METHODOLOGY
3 EXECUTIVE SUMMARY
4 MARKET LANDSCAPE
- 4.1 Market Overview
- 4.2 Market Drivers
- 4.2.1 Evolution of Industrial IoT and Digital Twin Adoption
- 4.2.2 Rapid Urbanization Spurring Civil Infrastructure Demand
- 4.2.3 Accelerated Product Life-Cycle Driving Outsourced Research and Development
- 4.2.4 Energy-Transition Mega-Projects (Hydrogen, CCUS) Requiring EPCM Expertise
- 4.2.5 Net-Zero Building Retrofit Mandates in OECD Economies
- 4.2.6 Defense Drone and Hypersonic Programs Needing Specialized Engineering
- 4.3 Market Restraints
- 4.3.1 Political Instability and Acute Skilled Labor Shortage
- 4.3.2 Input Cost and Supply-Chain Volatility
- 4.3.3 IP Security Concerns Limiting Defense Outsourcing
- 4.3.4 Slow Permitting for Utility-Scale Renewables
- 4.4 Industry Value Chain Analysis
- 4.5 Regulatory Landscape
- 4.6 Technological Outlook
- 4.7 Porter's Five Forces Analysis
- 4.7.1 Bargaining Power of Suppliers
- 4.7.2 Bargaining Power of Buyers
- 4.7.3 Threat of New Entrants
- 4.7.4 Threat of Substitutes
- 4.7.5 Intensity of Competitive Rivalry
- 4.8 Assessment of Macro-economic Trends on the Market
5 MARKET SIZE AND GROWTH FORECASTS (VALUE)
- 5.1 By Engineering Disciplines
- 5.1.1 Civil
- 5.1.2 Mechanical
- 5.1.3 Electrical
- 5.1.4 Piping and Structural
- 5.2 By Delivery Model
- 5.2.1 Offshore
- 5.2.2 Onsite
- 5.3 By Services
- 5.3.1 Product Engineering
- 5.3.2 Process Engineering
- 5.3.3 Automation Related Services
- 5.3.4 Asset Management Related Services
- 5.4 By End-user Industry
- 5.4.1 Aerospace and Defense
- 5.4.2 Automotive
- 5.4.3 Chemical and Petrochemical
- 5.4.4 Electric Power Generation
- 5.4.5 Municipal Utility Projects
- 5.4.6 Mining
- 5.4.7 Oil and Gas
- 5.4.8 Pharmaceuticals
- 5.4.9 Transportation
- 5.4.10 Telecommunications
- 5.4.11 Nuclear Projects
- 5.4.12 Other End-user Industries
- 5.5 By Geography
- 5.5.1 North America
- 5.5.1.1 United States
- 5.5.1.2 Canada
- 5.5.1.3 Mexico
- 5.5.2 South America
- 5.5.2.1 Brazil
- 5.5.2.2 Argentina
- 5.5.2.3 Rest of South America
- 5.5.3 Europe
- 5.5.3.1 Germany
- 5.5.3.2 United Kingdom
- 5.5.3.3 France
- 5.5.3.4 Italy
- 5.5.3.5 Spain
- 5.5.3.6 Rest of Europe
- 5.5.4 Asia-Pacific
- 5.5.4.1 China
- 5.5.4.2 Japan
- 5.5.4.3 India
- 5.5.4.4 Singapore
- 5.5.4.5 Australia
- 5.5.4.6 Malaysia
- 5.5.4.7 Rest of Asia-Pacific
- 5.5.5 Middle East and Africa
- 5.5.5.1 Middle East
- 5.5.5.1.1 Saudi Arabia
- 5.5.5.1.2 United Arab Emirates
- 5.5.5.1.3 Rest of Middle East
- 5.5.5.2 Africa
- 5.5.5.2.1 South Africa
- 5.5.5.2.2 Egypt
- 5.5.5.2.3 Rest of Africa
- 5.5.5.1 Middle East
- 5.5.1 North America
6 COMPETITIVE LANDSCAPE
- 6.1 Market Concentration
- 6.2 Strategic Moves
- 6.3 Market Share Analysis
- 6.4 Company Profiles (includes Global level Overview, Market level overview, Core Segments, Financials as available, Strategic Information, Market Rank/Share for key companies, Products and Services, and Recent Developments)
- 6.4.1 AECOM Engineering company
- 6.4.2 Bechtel Corporation
- 6.4.3 Kiewit Corporation
- 6.4.4 WSP Global Inc.
- 6.4.5 STRABAG SE
- 6.4.6 Fluor Corporation
- 6.4.7 Tetra Tech, Inc.
- 6.4.8 Arcadis NV
- 6.4.9 Stantec Inc.
- 6.4.10 AtkinsRealis Inc.
- 6.4.11 NV5 Global, Inc.
- 6.4.12 Black & Veatch Holding Co.
- 6.4.13 Balfour Beatty plc
- 6.4.14 HDR, Inc.
- 6.4.15 Wood PLC
- 6.4.16 China Communications Construction Co. Ltd.
- 6.4.17 Gilbane Building Company
- 6.4.18 Brasfield & Gorrie LLC
- 6.4.19 Jacobs Solutions Inc.
- 6.4.20 Barton Malow Inc.
7 MARKET OPPORTUNITIES AND FUTURE OUTLOOK
- 7.1 White-space and Unmet-Need Assessment

