
PUBLISHER: Mordor Intelligence | PRODUCT CODE: 1910672

PUBLISHER: Mordor Intelligence | PRODUCT CODE: 1910672
Paper Cups Industry - Market Share Analysis, Industry Trends & Statistics, Growth Forecasts (2026 - 2031)
Paper Cups Industry market size in 2026 is estimated at 5.41 Million tonnes, growing from 2025 value of 5.23 Million tonnes with 2031 projections showing 6.41 Million tonnes, growing at 3.45% CAGR over 2026-2031.
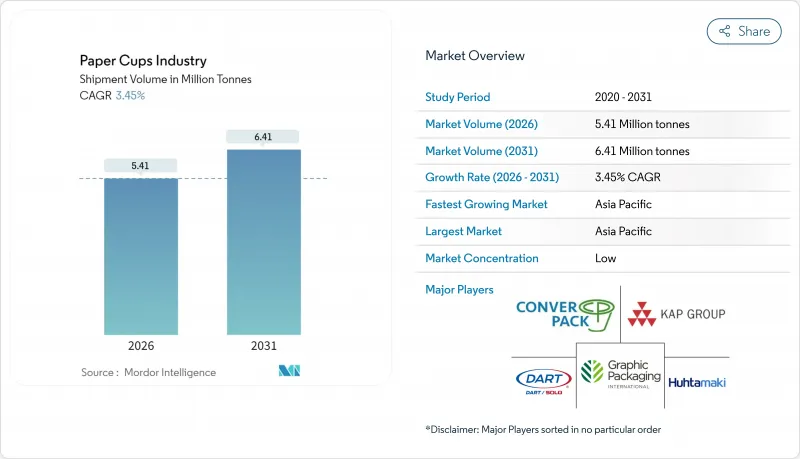
This steady rise in the paper cups market size reflects a regulatory push toward fiber-based packaging, rapid upgrades in aqueous and mineral coatings, and the widening preference of food-service brands for easily recyclable formats. Shifts in consumer behavior toward take-away beverages, the roll-out of new QSR outlets, and technological advances in high-speed forming lines are widening volume demand, while premiumization in mature economies is lifting unit revenues. Asia-Pacific leads global tonnage with 39.56% share in 2024, propelled by urbanization and food-delivery growth, whereas North America and Europe are pivoting toward low-PFAS, fully recyclable hot-cup formats that command higher margins. Competitive intensity remains moderate; incumbents leverage scale, vertical integration, and R&D investment to stay ahead of emerging specialty converters that target niche sustainability needs.
Global Paper Cups Industry Trends and Insights
Rising Demand for On-the-Go Beverages
Mobile lifestyles are lifting daily takeaway beverage volumes, positioning paper cups as the default pack for transit-friendly drinks. Urban commuters seek spill-proof formats that fit public-transport etiquette, and flexible work patterns elevate mid-day coffee runs. The U.S. food-delivery market is on track to generate USD 1.22 trillion in 2024, growing at 8.29% annually, underscoring how digital platforms translate app orders into incremental cup lifts. Specialty cafes expanding in Southeast Asia and the Middle East are introducing premium cup specifications that keep crema intact and print branding crisp. Loyalty apps encourage micro-purchases, which compound packaging volumes without requiring new footfall. Across regions, the result is a consistent, high-frequency pull on the paper cups market that aligns with retailer ambitions for frictionless service.
Government Bans on Single-Use Plastics
Legislators are turning single-use plastics into a costlier, restricted option, forcing a systemic shift toward fiber formats. The EU Packaging and Packaging Waste Regulation finalized in March 2024 mandates full recyclability and sets a 5% waste-cut target by 2030. South Australia banned plastic beverage containers from September 2024, instantly channeling demand to fiber cup alternatives. Scotland intends to levy a 25-pence surcharge on each single-use beverage cup by end-2025, nudging retailers toward reusable loops while positioning paper cups as the least-cost single-use substitute. These legal levers create predictable replacement cycles that let converters rationalize capex in new forming lines.
Disposal and Recycling Infrastructure Gaps
Many municipal systems still lack the equipment to delaminate cup fiber from coatings, so collected cups often end in landfill despite technical recyclability. Developing economies face limited material-recovery budgets, hindering paper cup sorting adoption. EU circular-economy rules tighten scrutiny on end-of-life pathways, and corporate buyers now demand evidence of regional cup recovery before awarding contracts. Until infrastructure catches up, the paper cups industry contends with reputational questions that can shift volumes to reusable pilots in niche cafes and venues.
Other drivers and restraints analyzed in the detailed report include:
- Expansion of QSR and Food-Delivery Ecosystems
- Aqueous-Coated Fully-Recyclable Hot-Cup Launches
- Pulp-Price Volatility Squeezing Margins
For complete list of drivers and restraints, kindly check the Table Of Contents.
Segment Analysis
Hot cups represented 44.92% of 2025 volume, and the segment is projected to expand at a 5.24% CAGR through 2031. The paper cups industry benefits from a global surge in specialty coffee houses that require high heat retention and vivid on-cup graphics for brand storytelling. Premium barrier coatings and double-wall builds deliver both, letting chains justify higher ticket prices. Cold cups protect share in iced tea, soda, and smoothie channels, yet growth lags because competition from lightweight PET cups persists in warm climates. Cone and specialty designs occupy event catering niches where differentiation, not mass volume, rules. Starbucks' switch to mineral coatings underscores how hot cups anchor R&D investment and margin capture. Cold-cup innovation focuses on strawless lids and fiber inks, but without the thermal barrier imperative, unit values stay lower.
Hot-cup leadership also reflects regional weather patterns and beverage rituals. Northern Europe and North America experience extended cool seasons that sustain daily hot-drink demand. In APAC mega-cities, iced beverage upticks occur, but hot tea traditions keep baseline consumption high enough to support a balanced portfolio. The paper cups industry adapts by offering modular lamination lines that toggle between hot and cold specs, ensuring asset utilization year-round. Specialty roasters ask suppliers for smaller minimum order quantities with frequent artwork changeovers, a service level only advanced converters can accommodate. This client dynamic moderates fragmentation by favoring scale players that bundle design, forming, and logistics.
Double-wall cups held 47.10% share in 2025, preferred for superior hand comfort and heat insulation. They also serve as a tactile signal of premium positioning in chain cafes. Yet single-wall designs are forecast to grow fastest at 5.78% CAGR through 2031. This acceleration stems from cost-saving goals in price-sensitive markets and from coating technologies that allow thin walls without hurting performance. Aqueous liners with micro-air pockets give single-wall cups sufficient heat resistance, enabling QSR operators to downgrade wall count while meeting customer expectations. Triple-wall cups remain niche, used in industrial canteens where boiling-hot broths are common.
Shifts in e-commerce packaging policies-favoring lower-weight parcels to cut freight emissions-also help single-wall formats. Direct-to-consumer coffee roasters that ship boxed drink kits favor slim cups to fit tight carbon calculators. On factory floors, converters re-engineer forming cycles to align with single-wall geometry, increasing line speed. Still, double-wall cups keep a foothold in high-margin markets. Chains with strong brand equity treat the thicker feel as part of the sensory experience. The paper cups market thus offers a bifurcated product mix: single-wall for broad affordability and double-wall for revenue-rich flagships.
The Paper Cups Market Report is Segmented by Cup Type (Hot Paper Cups, Cold Paper Cups, and More), Wall Type (Single Wall, Double Wall, Triple Wall), Capacity (4-8 Oz, 9-12 Oz, and More), End User (Quick-Service Restaurants, Coffee Chains and Vending Operators, and More), Distribution Channel (Direct B2B Contracts, and More), and Geography. The Market Forecasts are Provided in Terms of Volume (Million Tonnes).
Geography Analysis
Asia-Pacific accounted for 39.10% of global tonnage in 2025 and is projected to grow at 6.55% CAGR to 2031, the highest among all regions. China's paper sector added 10% domestic capacity in 2024, ensuring ample substrate for cup converting in 2025. India's packaging market is expected to reach USD 204.81 billion by 2025, expanding at 26.7% CAGR, a scale that deepens end-market pull for cups in food delivery. Vietnam's packaging growth of 9.73% annually demonstrates manufacturing competitiveness that also feeds cup exports across ASEAN. Rising disposable incomes and a shift toward branded cafe culture underpin regional volume, making APAC the growth anchor of the paper cups industry.
North America remains a mature yet technologically progressive market. The PFAS phase-out finalized by the U.S. FDA in February 2025 is propelling adoption of aqueous and mineral barrier coatings. Georgia-Pacific invested USD 2 billion in seven U.S. facilities in 2024 to sustain production agility and comply with sustainability targets. Modern recycling systems and corporate ESG reporting encourage premium offerings, with converters competing on end-of-life certification rather than pure price. Unit growth is slower, but margins are stronger through value-added specs such as fiber lids.
Europe follows a regulation-first trajectory. Mandatory recyclability by 2030 ensures steady substitution away from plastic packaging to paper-based cups. Huhtamaki expanded fiber-lid capacity in Northern Ireland in October 2024 to meet regional demand for plastic-free components. The region adopts pay-per-cup or tax incentives to nudge consumers toward reusables but still positions fiber cups as the compliant single-use option. Eastern European growth pockets, driven by rising QSR penetration, help offset Western Europe's mature volumes.
The Middle East and Africa and South America constitute emerging opportunity zones. Infrastructure gaps and economic swings temper immediate scale, yet food-delivery apps and international coffee chains are planting early seeds. Converters form joint ventures with local paper mills to localize supply, mitigating currency risk and import tariffs. While their contribution to the paper cups market size is still modest, longer-term demographic trends suggest incremental tonnage upside.
- Huhtamaki Oyj
- Dart Container Corp.
- Graphic Packaging International
- Georgia-Pacific LLC
- Seda International Packaging
- Kap Cones Pvt Ltd
- ConverPack Inc.
- Go-Pak UK Ltd (SCGP)
- Benders Paper Cups
- Hotpack Global
- Tekni-Plex Inc.
- CEE Schisler Packaging
- International Paper Foodservice
- Stora Enso Food-Service Boards
- Lollicup USA (Karat)
- Detmold Group
- F-Bender & Co.
- Nissin Paper Products
- Reynolds Consumer Products
- Pactiv Evergreen
Additional Benefits:
- The market estimate (ME) sheet in Excel format
- 3 months of analyst support
TABLE OF CONTENTS
1 INTRODUCTION
- 1.1 Study Assumptions and Market Definition
- 1.2 Scope of the Study
2 RESEARCH METHODOLOGY
3 EXECUTIVE SUMMARY
4 MARKET LANDSCAPE
- 4.1 Market Overview
- 4.2 Market Drivers
- 4.2.1 Rising demand for on-the-go beverages
- 4.2.2 Government bans on single-use plastics
- 4.2.3 Expansion of QSR and food-delivery ecosystems
- 4.2.4 Aqueous-coated fully-recyclable hot-cup launches
- 4.2.5 Zero-waste stadium and event procurement mandates
- 4.2.6 AI-driven high-speed forming lines lowering cost
- 4.3 Market Restraints
- 4.3.1 Disposal and recycling infrastructure gaps
- 4.3.2 Pulp-price volatility squeezing margins
- 4.3.3 Reusable cup loop pilots in coffee chains
- 4.3.4 PFAS-phase-out redesign and certification delays
- 4.4 Supply-Chain Analysis
- 4.5 Regulatory Landscape
- 4.6 Technological Outlook
- 4.7 Porter's Five Forces Analysis
- 4.7.1 Bargaining Power of Suppliers
- 4.7.2 Bargaining Power of Buyers
- 4.7.3 Threat of New Entrants
- 4.7.4 Threat of Substitutes
- 4.7.5 Competitive Rivalry
5 MARKET SIZE AND GROWTH FORECASTS (VALUE)
- 5.1 By Cup Type
- 5.1.1 Hot Paper Cups
- 5.1.2 Cold Paper Cups
- 5.1.3 Cone and Specialty Cups
- 5.2 By Wall Type
- 5.2.1 Single Wall
- 5.2.2 Double Wall
- 5.2.3 Triple Wall
- 5.3 By Capacity (oz)
- 5.3.1 4-8
- 5.3.2 9-12
- 5.3.3 13-20
- 5.3.4 >20
- 5.4 By End User
- 5.4.1 Quick-Service Restaurants (QSR)
- 5.4.2 Coffee Chains and Vending Operators
- 5.4.3 Institutional Catering
- 5.4.4 Airlines and Railways
- 5.4.5 Others
- 5.5 By Distribution Channel
- 5.5.1 Direct (B2B Contracts)
- 5.5.2 Distributors and Wholesalers
- 5.5.3 Online B2B Marketplaces
- 5.6 By Geography
- 5.6.1 North America
- 5.6.1.1 United States
- 5.6.1.2 Canada
- 5.6.1.3 Mexico
- 5.6.2 Europe
- 5.6.2.1 Germany
- 5.6.2.2 United Kingdom
- 5.6.2.3 France
- 5.6.2.4 Italy
- 5.6.2.5 Spain
- 5.6.2.6 Russia
- 5.6.2.7 Rest of Europe
- 5.6.3 Asia-Pacific
- 5.6.3.1 China
- 5.6.3.2 India
- 5.6.3.3 Japan
- 5.6.3.4 South Korea
- 5.6.3.5 Australia and New Zealand
- 5.6.3.6 Rest of Asia-Pacific
- 5.6.4 Middle East and Africa
- 5.6.4.1 Middle East
- 5.6.4.1.1 United Arab Emirates
- 5.6.4.1.2 Saudi Arabia
- 5.6.4.1.3 Turkey
- 5.6.4.1.4 Rest of Middle East
- 5.6.4.2 Africa
- 5.6.4.2.1 South Africa
- 5.6.4.2.2 Nigeria
- 5.6.4.2.3 Egypt
- 5.6.4.2.4 Rest of Africa
- 5.6.4.1 Middle East
- 5.6.5 South America
- 5.6.5.1 Brazil
- 5.6.5.2 Argentina
- 5.6.5.3 Rest of South America
- 5.6.1 North America
6 COMPETITIVE LANDSCAPE
- 6.1 Market Concentration
- 6.2 Strategic Moves
- 6.3 Market Share Analysis
- 6.4 Company Profiles (includes Global level Overview, Market level overview, Core Segments, Financials as available, Strategic Information, Market Rank/Share for key companies, Products and Services, and Recent Developments)
- 6.4.1 Huhtamaki Oyj
- 6.4.2 Dart Container Corp.
- 6.4.3 Graphic Packaging International
- 6.4.4 Georgia-Pacific LLC
- 6.4.5 Seda International Packaging
- 6.4.6 Kap Cones Pvt Ltd
- 6.4.7 ConverPack Inc.
- 6.4.8 Go-Pak UK Ltd (SCGP)
- 6.4.9 Benders Paper Cups
- 6.4.10 Hotpack Global
- 6.4.11 Tekni-Plex Inc.
- 6.4.12 CEE Schisler Packaging
- 6.4.13 International Paper Foodservice
- 6.4.14 Stora Enso Food-Service Boards
- 6.4.15 Lollicup USA (Karat)
- 6.4.16 Detmold Group
- 6.4.17 F-Bender & Co.
- 6.4.18 Nissin Paper Products
- 6.4.19 Reynolds Consumer Products
- 6.4.20 Pactiv Evergreen
7 MARKET OPPORTUNITIES AND FUTURE OUTLOOK
- 7.1 White-space and Unmet-Need Assessment

