
PUBLISHER: Mordor Intelligence | PRODUCT CODE: 1910692

PUBLISHER: Mordor Intelligence | PRODUCT CODE: 1910692
Mobile Wallet - Market Share Analysis, Industry Trends & Statistics, Growth Forecasts (2026 - 2031)
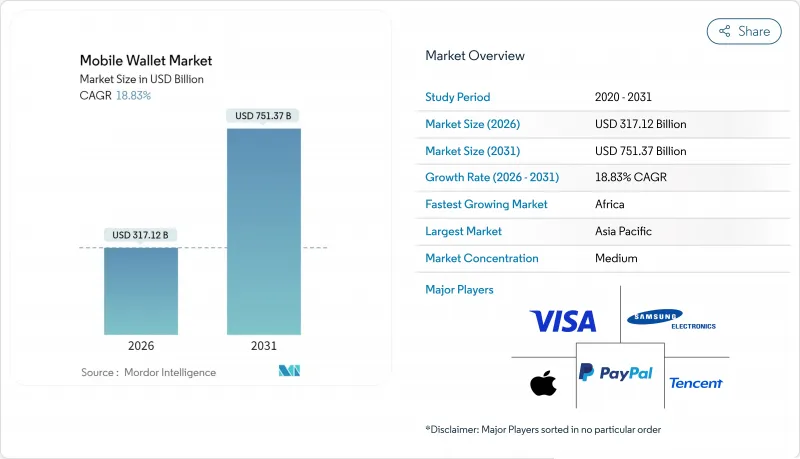
Mobile wallet market size in 2026 is estimated at USD 317.12 billion, growing from 2025 value of USD 266.85 billion with 2031 projections showing USD 751.37 billion, growing at 18.83% CAGR over 2026-2031.
Growth is powered by surging smartphone ownership, government mandates for real-time payment rails, and banks' strategic pivot toward contactless models. In 2024 Brazil's Pix processed 64 billion transactions, a 53% year-over-year jump, while India's UPI handled more than 120 billion transactions, confirming account-to-account systems as the principal accelerant of the mobile wallet market.Super-app ecosystems continue to deepen engagement, especially in Asia-Pacific, where mobile wallets are embedded across e-commerce, ride-hailing, and micro-lending journeys. Meanwhile, QR code rails lower merchant entry costs in emerging economies, helping small retailers bypass expensive POS terminals. Regulatory pressure on interchange fees, notably in the EU, is prompting providers to diversify into value-added services such as loyalty, lending, and insurance, reshaping monetization strategies.
Global Mobile Wallet Market Trends and Insights
Government-Mandated Real-Time Payment Rails Drive Market Transformation
Central bank initiatives are redefining competitive dynamics by offering instant, low-cost alternatives to card networks. Brazil's Pix processed R$ 26.5 trillion (USD 4.7 trillion) in 2024 and is on track to capture 58% of domestic e-commerce transactions within five years. Similar momentum is evident in India, where UPI growth has turned the platform into a public-private benchmark for interoperable payments. Cross-border experiments are under way, including Brazil's planned Pix corridor with other Latin American nations and the Japan-ASEAN QR partnership slated for fiscal 2025. Governments view these infrastructures as catalysts for financial sovereignty and more effective monetary policy transmission.
Super-App Ecosystems Reshape Consumer Payment Behavior
Embedding payments inside multi-service apps boosts engagement and lowers acquisition costs. Tencent reported 13% Q1 2025 revenue growth as WeChat Pay monetized its 1.4 billion monthly users. In Southeast Asia, Vietnam is projected to reach 50 million digital wallet users by end-2024, up 40% year over year. Western players such as PayPal are moving toward quasi-super-app roadmaps by fusing shopping, rewards, and credit, though data-privacy regimes slow full convergence. Competitive advantages stem from data-driven personalization, enabling tailored lending and insurance offers beyond straightforward payments.
EU Interchange-Fee Regulations Pressure Revenue Models
The EU extension of interchange caps through 2029 limits card-based wallet margins. Visa and Mastercard responded by introducing mobile virtual cards and expanding B2B wallets to compensate for retail fee compression. European initiatives such as the Wero wallet bypass card rails entirely, signaling a strategic pivot toward account-to-account architecture. Smaller providers lacking scale face consolidation pressure as monetization migrates to lending, data, and insurance.
Other drivers and restraints analyzed in the detailed report include:
- QR Code Infrastructure Accelerates Merchant Adoption in Emerging Markets
- Transit Digitization Creates High-Volume Use-Case Anchors
- Social-Engineering Fraud Undermines Consumer Trust
For complete list of drivers and restraints, kindly check the Table Of Contents.
Segment Analysis
Remote payments will expand at a 22.94% CAGR to 2031, overtaking growth in proximity transactions. E-commerce platforms increasingly favor wallets because they minimize checkout friction and enable instant refunds. Digital wallets captured 53% of global online spending in 2024. Cross-border functionality is a critical edge, letting consumers pay without legacy correspondent banking networks. Proximity payments nonetheless anchor daily activity in transit systems and retail. NFC tokens, shipped on 2.5 billion cards during 2024, remain relevant for high-frequency in-store transactions.
Proximity currently holds 63.62% of the mobile wallet market share in 2025, illustrating entrenched consumer habits in physical environments. Merchants invest in tap-and-go hardware to speed checkout and integrate loyalty. NFC and QR convergence inside single wallet apps blurs traditional mode distinctions, positioning omnichannel acceptance as the long-term differentiator.
Open wallets are projected to grow at a 24.60% CAGR on the back of regulatory demands for interoperability. Apple's decision to unlock iOS NFC to third parties in Europe signals a broader shift toward platform neutrality. Closed ecosystems still controlled 45.12% of revenue in 2025 due to superior user experience and tight hardware integration. Yet antitrust scrutiny and merchant pushback against platform fees temper their future pace.
Tokenization underpins secure interoperability. Visa has issued 10 billion tokens since 2014, avoiding USD 650 million in fraud. As open wallets compete on service layers rather than rails, differentiated onboarding, embedded credit, and contextual offers will shape adoption trajectories.
The Mobile Wallet Market Report is Segmented Into Mode of Payment (Proximity, Remote Payment), Application (Mobile Commerce, Money Transfer, and More), Wallet Type (Closed, Semi-Closed, Open), End-User (Personal, Business) and Geography. The Market Forecasts are Provided in Terms of Value (USD).
Geography Analysis
Asia-Pacific controlled 48.60% of 2025 transaction value, led by China's WeChat Pay and Alipay, which together handle over 90% of domestic mobile spending. India's UPI processed approximately 120 billion transfers in 2024, cementing the country's leadership in open payment infrastructure. Southeast Asian growth remains robust: Vietnam targets 50 million active wallets by end-2024, while Indonesia's QRIS transactions climbed 217% in one year. Japan's alliance with ASEAN to launch joint QR payment services by 2025 will deepen regional interoperability.
Africa is projected to post a 26.05% CAGR through 2031, anchored by mobile money solutions addressing gaps where 60% of adults are unbanked. Nigeria's burgeoning fintech scene and Kenya's mature M-Pesa ecosystem signal strong upside. Central banks are exploring digital currencies to further improve inclusion and payment efficiency.
Latin America demonstrates leapfrog dynamics. Brazil's Pix processed R$ 26.5 trillion in 2024 and already dominates 85% of national mobile transactions. Colombia doubled wallet users between 2021 and 2023, while Argentina's buy-now-pay-later adoption points to diversified wallet functions. Regional heterogeneity in regulation presents both opportunity and complexity for providers seeking scale.
- Apple Inc.
- Alphabet Inc.
- Samsung Electronics Co. Ltd.
- PayPal Holdings Inc.
- Tencent Holdings Ltd.
- Ant Group
- Visa Inc.
- MasterCard Inc.
- American Express Co.
- JPMorgan Chase & Co.
- Adyen NV
- Square Inc.
- Revolut Ltd.
- Grab Holdings Ltd.
- Paytm Payments Bank Ltd.
- One97 Communications
- PhonePe Pvt. Ltd.
- MobiKwik Systems Ltd.
- Mercado Libre Inc. (Mercado Pago)
- MTN Group (MoMo)
- Orange S.A.
Additional Benefits:
- The market estimate (ME) sheet in Excel format
- 3 months of analyst support
TABLE OF CONTENTS
1 INTRODUCTION
- 1.1 Study Assumptions and Market Definition
- 1.2 Scope of the Study
2 RESEARCH METHODOLOGY
3 EXECUTIVE SUMMARY
4 MARKET LANDSCAPE
- 4.1 Market Overview
- 4.2 Market Drivers
- 4.2.1 Rapid merchant adoption of QR-code wallets across Southeast Asia
- 4.2.2 Growth in super-app ecosystems integrating payments (China, India)
- 4.2.3 Government-mandated real-time payment rails (e.g., India UPI, Brazil Pix) spur wallet uptake
- 4.2.4 Transit authorities shifting to contactless fare collection Drives the Market
- 4.2.5 Card-network tokenization APIs lowering fraud for wallet transactions
- 4.3 Market Restraints
- 4.3.1 Interchange-fee caps in EU squeeze wallet revenue models
- 4.3.2 Patchy NFC handset penetration in LATAM mid-tier Android base
- 4.3.3 Fragmented KYC rules delaying onboarding in MENA
- 4.3.4 Rising account-to-account fraud via social-engineering drains trust
- 4.4 Value Chain Analysis
- 4.5 Regulatory Outlook
- 4.6 Technology Outlook
- 4.7 Porter's Five Forces Analysis
- 4.7.1 Bargaining Power of Suppliers
- 4.7.2 Bargaining Power of Consumers
- 4.7.3 Threat of New Entrants
- 4.7.4 Threat of Substitute Products
- 4.7.5 Intensity of Competitive Rivalry
- 4.8 Pricing Analysis
- 4.9 Industry Stakeholder Analysis
- 4.10 Investment Analysis
- 4.11 Assessment of Macro Economic Trends on the Market
5 MARKET SIZE AND GROWTH FORECASTS (VALUES)
- 5.1 By Mode of Payment
- 5.1.1 Proximity
- 5.1.2 Remote
- 5.2 By Wallet Type
- 5.2.1 Closed
- 5.2.2 Semi-Closed
- 5.2.3 Open
- 5.3 By Application
- 5.3.1 Retail and In-Store Payments
- 5.3.2 Mobile Commerce
- 5.3.3 Money Transfer & Remittance
- 5.3.4 Bill Payments and Recharge
- 5.3.5 Public Transport and Toll
- 5.3.6 Food and Hospitality
- 5.4 By End-User
- 5.4.1 Personal
- 5.4.2 Business
- 5.5 By Geography
- 5.5.1 North America
- 5.5.1.1 United States
- 5.5.1.2 Canada
- 5.5.1.3 Mexico
- 5.5.2 Europe
- 5.5.2.1 United Kingdom
- 5.5.2.2 Germany
- 5.5.2.3 France
- 5.5.2.4 Italy
- 5.5.2.5 Spain
- 5.5.2.6 Rest of Europe
- 5.5.3 Asia- Pacific
- 5.5.3.1 China
- 5.5.3.2 India
- 5.5.3.3 Japan
- 5.5.3.4 South Korea
- 5.5.3.5 Rest of Asia-Pacific
- 5.5.4 South America
- 5.5.4.1 Brazil
- 5.5.4.2 Argentina
- 5.5.4.3 Rest of South America
- 5.5.5 Middle East
- 5.5.5.1 United Arab Emirates
- 5.5.5.2 Saudi Arabia
- 5.5.5.3 Rest of Middle East
- 5.5.6 Africa
- 5.5.6.1 South Africa
- 5.5.6.2 Nigeria
- 5.5.6.3 Rest of Africa
- 5.5.1 North America
6 COMPETITIVE LANDSCAPE
- 6.1 Market Concentration
- 6.2 Strategic Moves
- 6.3 Market Share Analysis
- 6.4 Company Profiles {(includes Global level Overview, Market level overview, Core Segments, Financials as available, Strategic Information, Market Rank/Share, Products & Services, Recent Developments)}
- 6.4.1 Apple Inc.
- 6.4.2 Alphabet Inc.
- 6.4.3 Samsung Electronics Co. Ltd.
- 6.4.4 PayPal Holdings Inc.
- 6.4.5 Tencent Holdings Ltd.
- 6.4.6 Ant Group
- 6.4.7 Visa Inc.
- 6.4.8 MasterCard Inc.
- 6.4.9 American Express Co.
- 6.4.10 JPMorgan Chase & Co.
- 6.4.11 Adyen NV
- 6.4.12 Square Inc.
- 6.4.13 Revolut Ltd.
- 6.4.14 Grab Holdings Ltd.
- 6.4.15 Paytm Payments Bank Ltd.
- 6.4.16 One97 Communications
- 6.4.17 PhonePe Pvt. Ltd.
- 6.4.18 MobiKwik Systems Ltd.
- 6.4.19 Mercado Libre Inc. (Mercado Pago)
- 6.4.20 MTN Group (MoMo)
- 6.4.21 Orange S.A.
7 MARKET OPPORTUNITIES AND FUTURE OUTLOOK
- 7.1 White-space and Unmet-Need Assessment

