
PUBLISHER: Mordor Intelligence | PRODUCT CODE: 1910704

PUBLISHER: Mordor Intelligence | PRODUCT CODE: 1910704
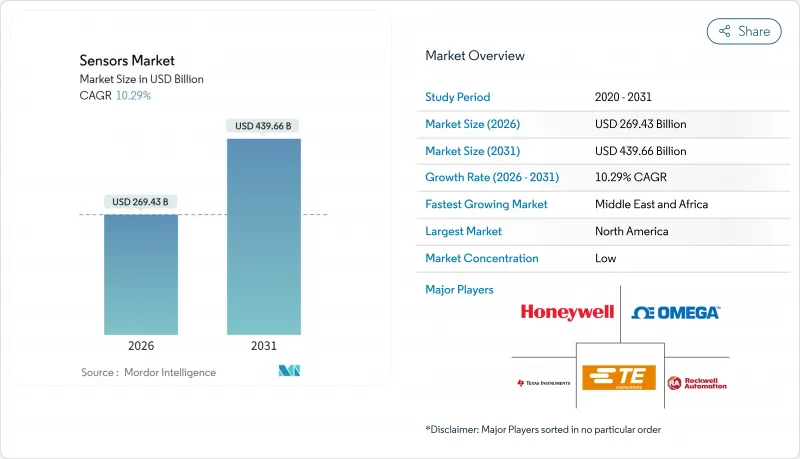
Sensors - Market Share Analysis, Industry Trends & Statistics, Growth Forecasts (2026 - 2031)
The sensors market is expected to grow from USD 244.31 billion in 2025 to USD 269.43 billion in 2026 and is forecast to reach USD 439.66 billion by 2031 at 10.29% CAGR over 2026-2031.
The growth is propelled by wider adoption of autonomous mobility platforms, rapid industrial automation, and expanding use-cases in connected healthcare. Convergence between artificial intelligence and sensor hardware is enabling predictive maintenance systems that cut unplanned factory downtime by up to 50%. Temperature devices currently dominate the sensors market with 23% share, while chemical variants are on track for the fastest expansion at a 14.8% CAGR. Asia-Pacific leads demand on the back of Chinese smart manufacturing programs, strong automotive innovation in Japan, and long-standing semiconductor supply chains. At the same time, Middle East & Africa is emerging as the quickest-growing region, supported by large-scale infrastructure digitalization and clean-energy buildouts. Competitive intensity remains high and fragmented, yet recent joint ventures and targeted acquisitions are accelerating consolidation around multimodal and AI-enabled product portfolios.
Global Sensors Market Trends and Insights
Increasing adoption of multi-sensor fusion in autonomous mobility
LiDAR, radar, and camera streams are now integrated into unified perception stacks, creating redundancy that meets the EU General Safety Regulation 2019/2144 for advanced driver assistance in all new vehicles. Tesla's full self-driving computer already processes inputs from 8 cameras, 12 ultrasonic units, and a radar at 144 TOPS, setting a performance benchmark. Tier-1 suppliers are responding with pre-calibrated perception suites that lower integration cost, compress bill-of-materials, and accelerate time-to-market.
Proliferation of smart-factory retrofits in brown-field Asian plants
China's 14th Five-Year Plan earmarked USD 1.4 trillion for digital infrastructure, much of which targets sensor-rich upgrades of legacy machinery to unlock predictive maintenance and 20-30% lifecycle extensions. Vibration, temperature, and flow devices fitted to existing lines feed cloud analytics that cut downtime and lift overall equipment effectiveness without full plant reconstruction.
Supply tightness of automotive-grade MEMS foundry capacity
AEC-Q100 qualification cycles span up to two years and only a few Asia-Pacific fabs meet the stringent criteria. STMicroelectronics is expanding clean-room footprints, yet EV proliferation adds pressure by introducing fresh battery-management and thermal-monitoring loads.
Other drivers and restraints analyzed in the detailed report include:
- Shift toward condition-based asset monitoring in offshore energy
- Mandatory inclusion of ADAS sensing suites in next-gen EU vehicles
- Calibration drift challenges in long-life vibration sensors
For complete list of drivers and restraints, kindly check the Table Of Contents.
Segment Analysis
Temperature devices held 22.74% sensors market share in 2025 and remain indispensable for automotive thermal loops and industrial process control. Chemical variants are scaling fastest, on course for 14.12% CAGR through 2031 on rising emissions monitoring and workplace-safety mandates. Flow, vibration, and pressure categories together deepen the sensors market with predictive maintenance reach, while proximity units ensure machine-guarding compliance.
Continued miniaturization now allows integrated AI engines inside temperature elements, enabling local anomaly detection without cloud latency. Inertial, magnetic, optical, and humidity devices round out the portfolio, serving everything from smartphone orientation to smart-city air-quality grids.
Electrical-resistance designs accounted for 19.18% of the sensors market in 2025 thanks to low cost and broad design-in across industrial and vehicle dashboards. LiDAR systems, critical for autonomous navigation, are projected to rise at 16.74% CAGR through 2031, reflecting price drops and movement to solid-state arrays that shed mechanical parts. Optical, piezoresistive, piezoelectric, capacitive, magnetic, and acoustic modes complete a diverse field addressing vision, pressure, vibration, touch, and sound requirements.
Advances such as Velodyne's 4D LiDAR integrate velocity vectors with distance and angle, sharpening object classification for driver-assist functions. Meanwhile, piezoelectric harvesters supply micro-joule power budgets for battery-less sensor nodes in remote pipelines.
Sensors Market Segmented by Parameter Measured (Temperature, Flow and More), Mode of Operation (Optical, Piezoresistive, Piezoelectric, and More), Technology (MEMS, Photonic, and More), Integration Level (Discrete Sensors, Integrated/Embedded Sensors), Output (Analog, Digital), End-User Industry (Automotive, Industrial Manufacturing, and More), and Geography. The Market Forecasts are Provided in Terms of Value (USD).
Geography Analysis
Asia-Pacific held 36.21% of global revenue in 2025, anchored by China's USD 1.4 trillion digital-infrastructure push, Japan's advanced automotive supply chains, and South Korea's lithography leadership. Government incentives lower capital hurdles for fabs and embedded-sensor startups alike, translating into a dense regional cluster of design and production know-how. Suppliers enjoy proximity to the bulk of consumer-electronics assembly lines, compressing lead times and logistics costs.
Europe delivers steady high-value demand around stringent safety and environmental regulations. Mandatory ADAS fitment and industrial decarbonization targets push purchasing toward higher-performance, functionally safe products. The EU's Chips Act grants and European Investment Bank loans such as NXP's EUR 1 billion facilities funnel fresh capacity into on-shore automotive-grade production.
Middle East & Africa is projected to expand at 14.58% CAGR as Gulf Cooperation Council states embed smart grids, desalination monitoring, and large-scale renewables. African mining and transport corridors increasingly deploy ruggedized sensors that tolerate dust, vibration, and power instability. Latin America, though smaller, sees smart-agriculture pilots across Brazil and Mexico, adding incremental volume.
- Honeywell International Inc.
- Bosch Sensortec GmbH
- Texas Instruments Inc.
- TE Connectivity Ltd
- Rockwell Automation Inc.
- OMEGA Engineering inc.
- STMicroelectronics N.V.
- Infineon Technologies AG
- NXP Semiconductors N.V.
- ams OSRAM AG
- Analog Devices Inc.
- Renesas Electronics Corp.
- Microchip Technology Inc.
- ROHM Semiconductor
- Omron Corp.
- ABB Ltd
- Sick AG
- Qualcomm Technologies Inc.
- Velodyne Lidar Inc.
- LeddarTech Inc.
- TDK Corp.
Additional Benefits:
- The market estimate (ME) sheet in Excel format
- 3 months of analyst support
TABLE OF CONTENTS
1 INTRODUCTION
- 1.1 Study Assumptions and Market Definition
- 1.2 Scope of the Study
2 RESEARCH METHODOLOGY
3 EXECUTIVE SUMMARY
4 MARKET LANDSCAPE
- 4.1 Market Overview
- 4.2 Market Drivers
- 4.2.1 Increasing adoption of multi-sensor fusion in autonomous mobility
- 4.2.2 Proliferation of smart-factory retrofits in brown-field Asian plants
- 4.2.3 Shift toward condition-based asset monitoring in offshore energy
- 4.2.4 Mandatory inclusion of ADAS sensing suites in next-gen EU vehicles
- 4.2.5 Ultra-low-power environmental sensing for battery-free IoT tags
- 4.3 Market Restraints
- 4.3.1 Supply tightness of automotive-grade MEMS foundry capacity
- 4.3.2 Calibration drift challenges in long-life vibration sensors
- 4.3.3 Fragmented wireless protocol standards hindering smart-sensor interoperability
- 4.4 Value and Supply-Chain Analysis
- 4.5 Regulatory and Technological Outlook
- 4.6 Porter's Five Forces Analysis
- 4.6.1 Bargaining Power of Suppliers
- 4.6.2 Bargaining Power of Buyers
- 4.6.3 Threat of New Entrants
- 4.6.4 Threat of Substitutes
- 4.6.5 Degree of Competition
- 4.7 Flexible and Printed Sensors Dynamics (current status, projections)
- 4.8 Macroeconomic and Pandemic Impact Assessment
5 MARKET SIZE AND GROWTH FORECASTS (VALUE)
- 5.1 By Parameter Measured
- 5.1.1 Temperature
- 5.1.2 Flow
- 5.1.3 Chemical
- 5.1.4 Vibration
- 5.1.5 Pressure
- 5.1.6 Proximity
- 5.1.7 Inertial
- 5.1.8 Other Parameters
- 5.2 By Mode of Operation
- 5.2.1 Optical
- 5.2.2 Piezoresistive
- 5.2.3 Piezoelectric
- 5.2.4 Electrical Resistance
- 5.2.5 Image
- 5.2.6 LiDAR
- 5.2.7 Other Modes
- 5.3 By Technology
- 5.3.1 MEMS
- 5.3.2 Photonic
- 5.3.3 CMOS
- 5.3.4 Nano-electromechanical (NEMS)
- 5.4 By Integration Level
- 5.4.1 Discrete Sensors
- 5.4.2 Integrated / Embedded Sensors
- 5.5 By Output
- 5.5.1 Analog
- 5.5.2 Digital
- 5.6 By End-user Industry
- 5.6.1 Automotive
- 5.6.2 Industrial Manufacturing
- 5.6.3 Medical and Wellness
- 5.6.4 Aerospace
- 5.6.5 Consumer Electronics
- 5.6.6 Oil and Gas
- 5.6.7 Construction
- 5.6.8 Defense
- 5.7 By Geography
- 5.7.1 North America
- 5.7.1.1 United States
- 5.7.1.2 Canada
- 5.7.1.3 Mexico
- 5.7.2 Europe
- 5.7.2.1 United Kingdom
- 5.7.2.2 Germany
- 5.7.2.3 France
- 5.7.2.4 Italy
- 5.7.2.5 Rest of Europe
- 5.7.3 Asia-Pacific
- 5.7.3.1 China
- 5.7.3.2 Japan
- 5.7.3.3 India
- 5.7.3.4 South Korea
- 5.7.3.5 Rest of Asia-Pacific
- 5.7.4 Middle East
- 5.7.4.1 Israel
- 5.7.4.2 Saudi Arabia
- 5.7.4.3 United Arab Emirates
- 5.7.4.4 Turkey
- 5.7.4.5 Rest of Middle East
- 5.7.5 Africa
- 5.7.5.1 South Africa
- 5.7.5.2 Egypt
- 5.7.5.3 Rest of Africa
- 5.7.6 South America
- 5.7.6.1 Brazil
- 5.7.6.2 Argentina
- 5.7.6.3 Rest of South America
- 5.7.1 North America
6 COMPETITIVE LANDSCAPE
- 6.1 Market Concentration
- 6.2 Strategic Moves
- 6.3 Market Share Analysis
- 6.4 Company Profiles (includes Global level Overview, Market level overview, Core Segments, Financials as available, Strategic Information, Market Rank/Share for key companies, Products and Services, and Recent Developments)
- 6.4.1 Honeywell International Inc.
- 6.4.2 Bosch Sensortec GmbH
- 6.4.3 Texas Instruments Inc.
- 6.4.4 TE Connectivity Ltd
- 6.4.5 Rockwell Automation Inc.
- 6.4.6 OMEGA Engineering inc.
- 6.4.7 STMicroelectronics N.V.
- 6.4.8 Infineon Technologies AG
- 6.4.9 NXP Semiconductors N.V.
- 6.4.10 ams OSRAM AG
- 6.4.11 Analog Devices Inc.
- 6.4.12 Renesas Electronics Corp.
- 6.4.13 Microchip Technology Inc.
- 6.4.14 ROHM Semiconductor
- 6.4.15 Omron Corp.
- 6.4.16 ABB Ltd
- 6.4.17 Sick AG
- 6.4.18 Qualcomm Technologies Inc.
- 6.4.19 Velodyne Lidar Inc.
- 6.4.20 LeddarTech Inc.
- 6.4.21 TDK Corp.
7 MARKET OPPORTUNITIES AND FUTURE OUTLOOK
- 7.1 White-space and Unmet-need Assessment

