
PUBLISHER: Mordor Intelligence | PRODUCT CODE: 1910712

PUBLISHER: Mordor Intelligence | PRODUCT CODE: 1910712
Polysilicon - Market Share Analysis, Industry Trends & Statistics, Growth Forecasts (2026 - 2031)
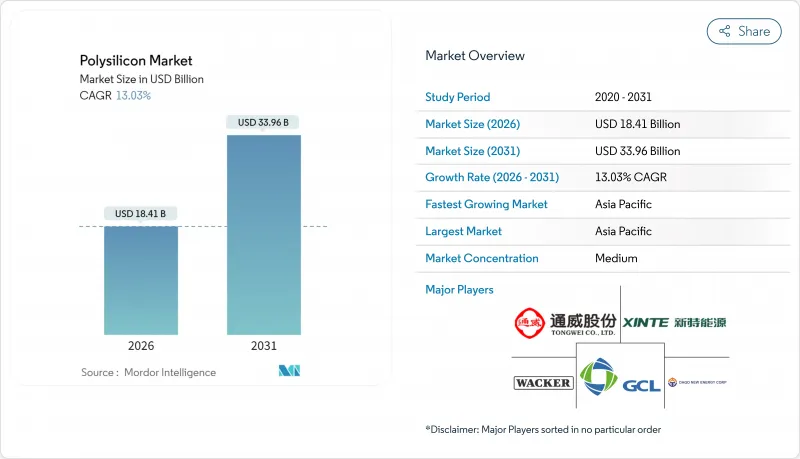
The Polysilicon Market was valued at USD 16.29 billion in 2025 and estimated to grow from USD 18.41 billion in 2026 to reach USD 33.96 billion by 2031, at a CAGR of 13.03% during the forecast period (2026-2031).
This growth trajectory stems from surging solar-PV build-outs, rising semiconductor capital expenditure, and policy incentives that promote regional supply diversification. A sharp pivot toward N-type TOPCon and heterojunction cell architectures is widening the purity gap between commodity and premium grades, while closed-loop silicon recycling advances steadily toward grid-parity economics. Meanwhile, Western forced-labor rules are redrawing trade lanes, creating a dual-pricing environment that rewards traceable, non-Xinjiang feedstock. Cost pressures remain intense as Chinese utilization rates hover below 40%, depressing spot prices even as long-term semiconductor contracts preserve margins for ultra-high-purity producers.
Global Polysilicon Market Trends and Insights
Massive Global Solar-PV Build-Out
Global PV installations accelerated from 191 GW in 2022 to 444 GW in 2023, a 132% surge that compressed upstream supply chains and fortified polysilicon market demand. Developers raced to lock in modules ahead of China's June 2025 grid-tariff shift, stretching feedstock lead times beyond typical 18-month capacity additions. Although fresh Chinese reactors are entering service, commissioning lags keep inventories thin in high-efficiency grades. Project pipelines in India and Southeast Asia compound the pull on available volumes, reinforcing a multi-year growth runway despite current price softness. Forward contract activity indicates that buyers remain willing to pay premiums for traceable, non-Xinjiang material to ensure regulatory compliance in the United States and Europe.
AI-Driven Semiconductor CAPEX Super-Cycle
Advanced logic and memory fabs below the 3-nm node consume up to triple the high-purity polysilicon per wafer versus legacy lines because of tighter contamination thresholds. Annual foundry investments topping USD 200 billion underpin long-dated offtake agreements that shield suppliers from solar price volatility. The U.S. CHIPS Act (USD 52 billion) and the EU Chips Act together aim to boost local wafer output to 20% of global share by 2030, pulling incremental polysilicon tonnage into North America and Europe. Producers capable of 11N-grade specifications capture 300-400% price premiums over solar-grade parcels, cushioning margins and funding process upgrades.
Prolonged Capacity Overhang
Chinese producers ran at roughly 33% utilization in Q1 2025, selling below cash costs as spot prices plunged from CNY 72,100 to CNY 34,000 per ton. The glut stems from 2021-23 build-outs that outpaced wafer line expansions, locking the polysilicon market into a clearing-price mentality through 2026. Beijing's energy-efficiency audits may shutter 20-30% of sub-scale reactors, but the timing remains uncertain. Until rationalization materializes, producers with higher electricity or TCS costs face negative margins and constrained capex, limiting near-term technology retrofits.
Other drivers and restraints analyzed in the detailed report include:
- IRA and Fit-for-55 Onshoring Incentives
- Closed-Loop Silicon Recycling Reaches Parity
- UMG Silicon Substitution Threat
For complete list of drivers and restraints, kindly check the Table Of Contents.
Segment Analysis
Siemens reactors retained a 66.42% polysilicon market share in 2025, producing 11N-grade output prized by both solar and semiconductor buyers. Yet, sustained commodity price erosion heightens focus on power consumption; Siemens lines draw 60-70 kWh per kilogram, pressuring margins in high-tariff regions. The polysilicon market size for Fluidized Bed Reactor (FBR) output is projected to surge at 14.18% CAGR, aided by 25% lower electricity use and continuous powder discharge that trims capex per tonne. Recent Tsinghua University studies confirm 40% higher deposition rates in optimized FBR columns, bolstering adoption for brownfield retrofits. Still, FBR vendors must address powder contamination risks to penetrate the semiconductor space. Upgraded metallurgical-grade silicon occupies a niche today, but pilot plants in Canada and Norway signal growing interest among vertically integrated wafer firms seeking cost ceilings.
Power-price arbitrage is shaping global investment patterns: Middle East projects leverage sub-USD 0.03/kWh renewables to justify Siemens builds targeting 10N-grade solar feedstock, while U.S. Gulf Coast lines employ combined-cycle gas to exploit Section 45X tax rebates. Environmental scrutiny also plays a role; European financiers require lifecycle CO2 disclosures, favoring FBR's lower per-kilogram carbon footprint. Overall, technology choice is becoming a strategic lever, balancing capex, opex, purity, and carbon criteria across regional energy landscapes within the polysilicon market.
The Polysilicon Market Report is Segmented by Production Process (Siemens (TCS-CVD), Fluidized Bed Reactor (Silane-FBR), Upgraded Metallurgical-Grade (UMG)), End-User Industry (Solar Photovoltaics, Electronics and Semiconductors), and Geography (Asia-Pacific, North America, Europe, South America, Middle East and Africa). The Market Forecasts are Provided in Terms of Value (USD).
Geography Analysis
Asia-Pacific dominated the polysilicon market with 65.70% revenue share in 2025, riding on China's integrated supply chain that spans quartz mining to module assembly. Provincial incentives helped Chinese nameplate capacity exceed 400 kilotonnes, yet chronic oversupply slashed plant utilization and triggered margin erosion. India adds a strategic demand layer: its 500 GW renewables target by 2030 implies annual silicon imports exceeding 150 kilotonnes unless local ventures materialize. Japan and South Korea focus on semiconductor-grade volumes, leveraging long-standing purity expertise but facing high electricity costs that hinder brownfield expansions.
North America enters a renaissance phase as the Inflation Reduction Act re-anchors manufacturing. REC Silicon's Moses Lake restart will deliver 14 kilotonnes of FBR powder by 2026, but U.S. solar installations could exceed 50 GW annually, leaving a structural deficit covered by imports from Malaysia and Germany. Section 301 tariffs and Uyghur Forced Labor Prevention Act detentions complicate logistics, fostering a premium spot market for traceable cargoes. Canada offers hydropower-driven low-carbon electricity, drawing feasibility studies for semiconductor-grade plants aiming at 10-kilotonne scales.
Europe balances ambitious Fit-for-55 targets against steep industrial power tariffs that average EUR 0.27/kWh, twice U.S. levels. Nevertheless, Norway's hydro surplus underpins proposals for FBR facilities targeting net-zero Scope 2 emissions, a credential valued by EU module buyers.
Middle East actors pursue energy-cost arbitrage: Oman's 100-kilotonne project leverages sub-USD 0.03/kWh solar power and port proximity to serve Asia and Africa. Africa remains an emerging market, with Egypt and Morocco investigating smelter-enabled UMG pathways linked to domestic solar goals.
- Asia Silicon (Qinghai) Co. Ltd
- DAQO NEW ENERGY CO. LTD
- GCL-TECH
- Hemlock Semiconductor Operations LLC and Hemlock Semiconductor LLC
- Mitsubishi Polycrystalline Silicon America Corporation
- OCI Company Ltd
- Qatar Solar Technologies
- REC Silicon ASA
- Sichuan Yongxiang Co. Ltd (Tongwei)
- Tokuyama Corporation
- Tongwei Co., Ltd
- United Solar Polysilicon (FZC) SPC
- Wacker Chemie AG
- Xinte Energy Co. Ltd
Additional Benefits:
- The market estimate (ME) sheet in Excel format
- 3 months of analyst support
TABLE OF CONTENTS
1 Introduction
- 1.1 Study Assumptions and Market Definition
- 1.2 Scope of the Study
2 Research Methodology
3 Executive Summary
4 Market Landscape
- 4.1 Market Overview
- 4.2 Market Drivers
- 4.2.1 Massive global solar-PV build-out (utility-scale + distributed)
- 4.2.2 AI-driven semiconductor CAPEX super-cycle (3-nm and below nodes)
- 4.2.3 IRA-/Fit-for-55-driven polysilicon onshoring incentives
- 4.2.4 Next-gen N-type TOPCon/IBC cell demand for ultra-high-purity poly
- 4.2.5 Closed-loop silicon recycling economics reach grid parity (2030)
- 4.3 Market Restraints
- 4.3.1 Prolonged 2024-26 capacity overhang and sub-cash-cost pricing
- 4.3.2 UMG-Si substitution risk in low-spec PV segments
- 4.3.3 Western forced-labour audit rules on Xinjiang feedstock
- 4.4 Value Chain Analysis
- 4.5 Porter's Five Forces
- 4.5.1 Bargaining Power of Suppliers
- 4.5.2 Bargaining Power of Buyers
- 4.5.3 Threat of New Entrants
- 4.5.4 Threat of Substitutes
- 4.5.5 Degree of Competition
- 4.6 Technological Snapshot
5 Market Size and Growth Forecasts (Value)
- 5.1 By Production Process
- 5.1.1 Siemens (TCS-CVD)
- 5.1.2 Fluidized Bed Reactor (Silane-FBR)
- 5.1.3 Upgraded Metallurgical-Grade (UMG)
- 5.2 By End-user Industry
- 5.2.1 Solar Photovoltaics
- 5.2.1.1 Monocrystalline Solar Panel
- 5.2.1.2 Multicrystalline Solar Panel
- 5.2.2 Electronics and Semiconductors
- 5.2.1 Solar Photovoltaics
- 5.3 By Geography
- 5.3.1 Asia-Pacific
- 5.3.1.1 China
- 5.3.1.2 India
- 5.3.1.3 Japan
- 5.3.1.4 South Korea
- 5.3.1.5 Rest of Asia-Pacific
- 5.3.2 North America
- 5.3.2.1 United States
- 5.3.2.2 Canada
- 5.3.2.3 Mexico
- 5.3.3 Europe
- 5.3.3.1 Germany
- 5.3.3.2 United Kingdom
- 5.3.3.3 France
- 5.3.3.4 Italy
- 5.3.3.5 Rest of Europe
- 5.3.4 South America
- 5.3.4.1 Brazil
- 5.3.4.2 Argentina
- 5.3.4.3 Rest of South America
- 5.3.5 Middle East and Africa
- 5.3.5.1 Saudi Arabia
- 5.3.5.2 South Africa
- 5.3.5.3 Rest of Middle East and Africa
- 5.3.1 Asia-Pacific
6 Competitive Landscape
- 6.1 Market Concentration
- 6.2 Strategic Moves
- 6.3 Market Share (%)**/Ranking Analysis
- 6.4 Company Profiles (includes Global level Overview, Market level overview, Core Segments, Financials as available, Strategic Information, Market Rank/Share, Products and Services, Recent Developments)
- 6.4.1 Asia Silicon (Qinghai) Co. Ltd
- 6.4.2 DAQO NEW ENERGY CO. LTD
- 6.4.3 GCL-TECH
- 6.4.4 Hemlock Semiconductor Operations LLC and Hemlock Semiconductor LLC
- 6.4.5 Mitsubishi Polycrystalline Silicon America Corporation
- 6.4.6 OCI Company Ltd
- 6.4.7 Qatar Solar Technologies
- 6.4.8 REC Silicon ASA
- 6.4.9 Sichuan Yongxiang Co. Ltd (Tongwei)
- 6.4.10 Tokuyama Corporation
- 6.4.11 Tongwei Co., Ltd
- 6.4.12 United Solar Polysilicon (FZC) SPC
- 6.4.13 Wacker Chemie AG
- 6.4.14 Xinte Energy Co. Ltd
7 Market Opportunities and Future Outlook
- 7.1 White-Space and Unmet-Need Assessment

