
PUBLISHER: Mordor Intelligence | PRODUCT CODE: 1910718

PUBLISHER: Mordor Intelligence | PRODUCT CODE: 1910718
Geographic Information System - Market Share Analysis, Industry Trends & Statistics, Growth Forecasts (2026 - 2031)
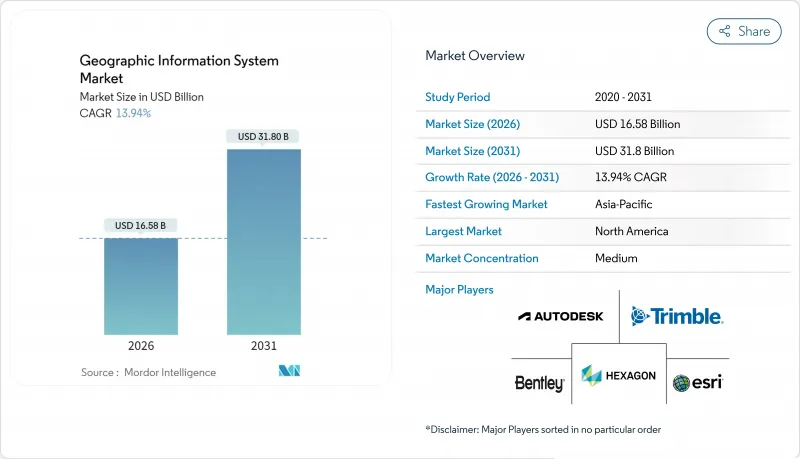
The Geographic Information System market was valued at USD 14.56 billion in 2025 and estimated to grow from USD 16.58 billion in 2026 to reach USD 31.8 billion by 2031, at a CAGR of 13.94% during the forecast period (2026-2031).
Rapid smart-city roll-outs, national open-data mandates, and cloud-native deployments keep demand on an upward slope. Automated feature extraction from sub-30 cm imagery and real-time spatial analytics now reduce decision latency from weeks to minutes, pushing adoption in transportation, oil and gas, and public safety applications. Vendors that bundle AI, edge processing, and managed services continue to gain share as enterprises prioritize scalability and cyber-secure integration with operational networks.
Global Geographic Information System Market Trends and Insights
Widespread Smart-City Roll-Outs Require Real-Time Geospatial Infrastructure
City agencies are integrating the Geographic information system market platforms with 5G, IoT, and edge compute to orchestrate urban services. Singapore's Open Digital Platform synchronizes district cooling, waste, and energy through streaming geospatial feeds, improving incident response and infrastructure uptime. Los Angeles uses real-time dashboards to route emergency crews, drawing 3.5 million situational-awareness map views during peak events. As municipalities budget for digital twins, vendors that deliver scalable 3D visualization, sensor APIs, and cybersecurity hardening capture a growing portion of public-sector IT spend.
Cloud-Native GIS Lowers TCO and Speeds Enterprise Integration
Bell Canada saved 40-60% in infrastructure outlay by shifting to a cloud-native geospatial data platform, illustrating how containerized micro-services and managed upgrades shorten deployment cycles. ArcGIS Enterprise on Kubernetes and similar offerings align GIS operations with DevOps pipelines, allowing dynamic scaling during disaster events without procurement delays. Push-down analytics in cloud data warehouses eliminate ETL bottlenecks, widening the Geographic information system market addressable base beyond traditional mapping teams.
Legacy IT Integration Complexity with OT and SCADA Systems
Utilities merging modern GIS with decades-old SCADA confront data-model mismatches, protocol gaps, and new cyber-threat surfaces. Liberty Utilities extended its migration timeline by 18 months due to iterative testing and middleware development. These overruns shift spending toward professional services, slowing software conversions in the Geographic information system market.
Other drivers and restraints analyzed in the detailed report include:
- Mobile-First Field-Data-Collection Platforms Expand Addressable User Base
- AI-Powered Auto-Classification of Satellite Imagery Accelerates Analytics
- Persistent Data-Quality / Lineage Gaps in Crowdsourced Layers
For complete list of drivers and restraints, kindly check the Table Of Contents.
Segment Analysis
Services revenue in the Geographic information system market rose sharply in 2026, advancing at a 15.45% CAGR as enterprises outsourced cloud migration, AI model tuning, and lifecycle support. Managed-service bundles now cover data-quality audits, security patching, and 24/7 monitoring, shifting spending from capital to operating budgets. Software still accounts for 53.60% of 2025 sales, anchored by the ArcGIS, Hexagon NetWorks, and Trimble Cityworks portfolios. Their continuous update cadence, Esri reinvests roughly 28% of annual turnover into R&D, keeping feature velocity high, while open-API frameworks welcome third-party extensions. Hardware remains essential for GNSS receivers, lidar scanners, and rugged tablets, yet margins compress as more functions migrate into the software layer. The geographic information system market size tied to pure hardware shipments therefore grows more slowly, even as sensor count climbs.
Industry buyers favor vendors that can deliver outcome-oriented service-level agreements; for example, Hexagon's 2025 decision to divest non-core assets freed capital to bolster subscription support offerings. Training academies, DevOps toolchains, and certified partner networks now form critical selection criteria, signaling a pivot from license counts to customer success metrics across the Geographic information system market.
Mapping held a 34.10% share in 2025, furnishing the spatial context for every downstream workflow. Yet the analytics sub-segment is expanding fastest at 15.70% CAGR, powered by edge inference, foundation models, and data-lakehouse architectures. Enterprises embed predictive geofencing into ERPs, while authorities model urban heat islands through multi-spectral stacks. Surveying remains steady, reinvented through drone photogrammetry that compresses week-long terrain captures into same-day deliverables.
Telematics gains from electric-vehicle routing and cold-chain monitoring, integrating EV-specific range calculations. Location-based services flourish via hyper-personalized retail apps that trigger in-store promotions, though competition from native smartphone OS APIs keeps vendor margins in check. Overall, the Geographic information system market aligns functional roadmaps around holistic data-fabric principles, merging ingestion, cataloging, and AI pipelines under a single governance umbrella.
The Geographic Information System (GIS) Market Report is Segmented by Component (Hardware, Software, and Services), Function (Mapping, Surveying, and More), Deployment Mode (On-Premise and Cloud), End-User Industry (Agriculture, Utilities, Mining, Construction, and More), and Geography. The Market Forecasts are Provided in Terms of Value (USD).
Geography Analysis
North America preserved 37.80% of 2025 spending, thanks to mature cloud infrastructure, robust R&D funding, and agency mandates like the U.S. Geospatial Data Act that standardize interoperability and metadata. Federal programs secure multi-year budgets for wildfire modeling, broadband equity mapping, and critical-infrastructure resilience. Enterprises such as Trimble invest more than USD 660 million annually in innovation, generating patents that reinforce the region's technological edge. Yet rising cloud-de-storage fees pose cost challenges for petabyte-class imagery analytics, motivating negotiations for localized sovereign clouds.
Asia-Pacific is on track for the highest 15.95% regional CAGR, fuelled by megacity modernization and infrastructure stimulus. Singapore scales 3D underground mapping to mitigate space constraints, while India's Digital Twin Mission links logistics corridors with unified parcel-level cadasters. Saudi Arabia's USD 1 billion digital-twin collaboration with Naver underscores Gulf ambitions for smart-city leadership. Regional hurdles include fragmented data-residency rules and varying export controls, yet domestic satellite launches and sovereign cloud zones are mitigating dependencies.
Europe's growth remains steady, anchored by the INSPIRE directive that democratizes high-value datasets. Open access spawns start-ups specializing in climate-risk scoring and renewable-siting analytics. GDPR influences architecture design, spurring privacy-enhancing computation and in-region processing. South America, the Middle East, and Africa together represent a smaller base but display accelerated adoption in mineral exploration, precision agriculture, and infrastructure security. These markets often leapfrog legacy systems, adopting cloud-native GIS from inception, thereby enlarging the Geographic information system market size through greenfield demand.
- Environmental Systems Research Institute, Inc. (Esri)
- Hexagon AB
- Trimble Inc.
- Autodesk, Inc.
- Bentley Systems, Incorporated
- Topcon Positioning Systems, Inc.
- Pitney Bowes, Inc. (Precisely)
- Caliper Corporation
- Mapbox, Inc.
- Maxar Technologies Inc.
- Fugro N.V.
- SuperMap Software Co., Ltd.
- CARTO (CartoDB Inc.)
- Blue Marble Geographics, LLC
- GIS Cloud Ltd.
- TomTom N.V.
- Seequent Limited
- Spatialworks, Inc.
- Geosoft Inc.
- Woolpert, Inc.
- NV5 Geospatial Solutions, Inc.
- BlackSky Technology Inc.
Additional Benefits:
- The market estimate (ME) sheet in Excel format
- 3 months of analyst support
TABLE OF CONTENTS
1 INTRODUCTION
- 1.1 Study Assumptions and Market Definition
- 1.2 Scope of the Study
2 RESEARCH METHODOLOGY
3 EXECUTIVE SUMMARY
4 MARKET LANDSCAPE
- 4.1 Market Overview
- 4.2 Market Drivers
- 4.2.1 Widespread smart-city roll-outs require real-time geospatial infrastructure
- 4.2.2 Cloud-native GIS lowers TCO and speeds enterprise integration
- 4.2.3 Mobile-first field-data-collection platforms expand addressable user base
- 4.2.4 AI-powered auto-classification of satellite imagery accelerates analytics
- 4.2.5 Sub-30 cm commercial microsatellite constellations unlock new precision use-cases
- 4.2.6 National open-data mandates (EU INSPIRE 2.0, US GDA, etc.) drive adoption
- 4.3 Market Restraints
- 4.3.1 Legacy IT integration complexity with OT and SCADA systems
- 4.3.2 Persistent data-quality/lineage gaps in crowdsourced layers
- 4.3.3 Rising cloud-egress fees for petabyte-scale imagery archives
- 4.3.4 Export-control tightening on high-resolution geospatial data
- 4.4 Value Chain Analysis
- 4.5 Regulatory Landscape
- 4.6 Technological Outlook
- 4.7 Industry Attractiveness - Porter's Five Forces Analysis
- 4.7.1 Bargaining Power of Suppliers
- 4.7.2 Bargaining Power of Buyers
- 4.7.3 Threat of New Entrants
- 4.7.4 Threat of Substitutes
- 4.7.5 Intensity of Competitive Rivalry
- 4.8 Impact of Macroeconomic Factors on the Market
5 MARKET SIZE AND GROWTH FORECASTS (VALUES)
- 5.1 By Component
- 5.1.1 Hardware
- 5.1.2 Software
- 5.1.3 Services
- 5.2 By Function
- 5.2.1 Mapping
- 5.2.2 Surveying
- 5.2.3 Telematics and Navigation
- 5.2.4 Location-based Services
- 5.2.5 Geospatial Data Management and Analysis
- 5.3 By Deployment Mode
- 5.3.1 On-premise
- 5.3.2 Cloud
- 5.4 By End-user Industry
- 5.4.1 Agriculture
- 5.4.2 Utilities
- 5.4.3 Mining
- 5.4.4 Construction
- 5.4.5 Transportation and Logistics
- 5.4.6 Oil and Gas
- 5.4.7 Government and Defence
- 5.4.8 Telecommunications
- 5.4.9 Other End-user Industries
- 5.5 By Geography
- 5.5.1 North America
- 5.5.1.1 United States
- 5.5.1.2 Canada
- 5.5.1.3 Mexico
- 5.5.2 South America
- 5.5.2.1 Brazil
- 5.5.2.2 Argentina
- 5.5.2.3 Chile
- 5.5.2.4 Rest of South America
- 5.5.3 Europe
- 5.5.3.1 Germany
- 5.5.3.2 United Kingdom
- 5.5.3.3 France
- 5.5.3.4 Italy
- 5.5.3.5 Spain
- 5.5.3.6 Rest of Europe
- 5.5.4 Asia-Pacific
- 5.5.4.1 China
- 5.5.4.2 India
- 5.5.4.3 Japan
- 5.5.4.4 South Korea
- 5.5.4.5 Malaysia
- 5.5.4.6 Singapore
- 5.5.4.7 Australia
- 5.5.4.8 Rest of Asia-Pacific
- 5.5.5 Middle East and Africa
- 5.5.5.1 Middle East
- 5.5.5.1.1 United Arab Emirates
- 5.5.5.1.2 Saudi Arabia
- 5.5.5.1.3 Turkey
- 5.5.5.1.4 Rest of Middle East
- 5.5.5.2 Africa
- 5.5.5.2.1 South Africa
- 5.5.5.2.2 Nigeria
- 5.5.5.2.3 Rest of Africa
- 5.5.5.1 Middle East
- 5.5.1 North America
6 COMPETITIVE LANDSCAPE
- 6.1 Market Concentration
- 6.2 Strategic Moves
- 6.3 Market Share Analysis
- 6.4 Company Profiles (includes Global level Overview, Market level overview, Core Segments, Financials as available, Strategic Information, Market Rank/Share for key companies, Products and Services, and Recent Developments)
- 6.4.1 Environmental Systems Research Institute, Inc. (Esri)
- 6.4.2 Hexagon AB
- 6.4.3 Trimble Inc.
- 6.4.4 Autodesk, Inc.
- 6.4.5 Bentley Systems, Incorporated
- 6.4.6 Topcon Positioning Systems, Inc.
- 6.4.7 Pitney Bowes, Inc. (Precisely)
- 6.4.8 Caliper Corporation
- 6.4.9 Mapbox, Inc.
- 6.4.10 Maxar Technologies Inc.
- 6.4.11 Fugro N.V.
- 6.4.12 SuperMap Software Co., Ltd.
- 6.4.13 CARTO (CartoDB Inc.)
- 6.4.14 Blue Marble Geographics, LLC
- 6.4.15 GIS Cloud Ltd.
- 6.4.16 TomTom N.V.
- 6.4.17 Seequent Limited
- 6.4.18 Spatialworks, Inc.
- 6.4.19 Geosoft Inc.
- 6.4.20 Woolpert, Inc.
- 6.4.21 NV5 Geospatial Solutions, Inc.
- 6.4.22 BlackSky Technology Inc.
7 MARKET OPPORTUNITIES AND FUTURE OUTLOOK
- 7.1 White-space and Unmet-Need Assessment

