
PUBLISHER: Mordor Intelligence | PRODUCT CODE: 1910804

PUBLISHER: Mordor Intelligence | PRODUCT CODE: 1910804
Fluorspar - Market Share Analysis, Industry Trends & Statistics, Growth Forecasts (2026 - 2031)
The Fluorspar market is expected to grow from 8.01 Million tons in 2025 to 8.23 Million tons in 2026 and is forecast to reach 9.44 Million tons by 2031 at 2.77% CAGR over 2026-2031.
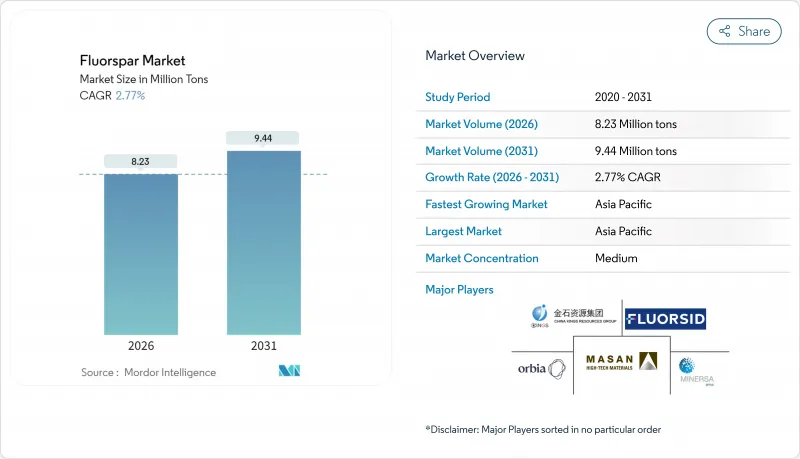
Stable volume growth reflects the mineral's entrenched use in hydrofluoric-acid production, steel and aluminum metallurgy, and fluoropolymer manufacturing, even as new demand streams emerge from battery, semiconductor, and refrigerant supply chains. China remains the pivotal supplier, responsible for more than 60% of mined output, and its export-control posture is prompting end users to dual-source, stockpile, and enter long-term offtake contracts.
Global Fluorspar Market Trends and Insights
Fluorochemicals Demand Boom Drives Market Expansion
Low-global-warming-potential refrigerants are underpinning a steep rise in hydrofluoric-acid consumption, highlighted by Chemours' 25% sequential revenue jump in its Thermal and Specialized Solutions segment during Q2 2025. The U.S. AIM Act schedule is accelerating replacement of high-GWP HFCs, and parallel EU F-Gas rules are pushing similar adoption curves across Europe. Each electric vehicle uses roughly 30 kg of acid-spar equivalent in binders, coolants, and wire coatings, linking battery growth directly to bulk fluorspar demand. Fluoropolymer applications in fuel-cell membranes and hydrogen infrastructure add a secondary pull. Process innovation is also noteworthy: South Korean researchers lifted hydrofluoroether yield by 12-16 percentage points via an advanced electrochemical route, hinting at future reductions in raw-ore intensity per ton of finished fluorochemical.
Steel and Aluminum Production Surge in Emerging Markets
India's crude-steel output climbed to 151.967 million tons in fiscal 2024-25, up 5.3% year on year, while domestic consumption advanced, driving incremental metallurgical-grade fluorspar procurement for slag-conditioning and desulfurization. Gulf Cooperation Council smelters are scaling capacity under Saudi Vision 2030, leveraging low-cost energy to expand aluminum output and corresponding aluminum-fluoride demand. Circular-economy advances are equally material: a ScienceDirect study achieved 85.6% extraction of high-purity AlF3 from waste cryolite, indicating that secondary feedstock could displace 15-20% of primary acidspar needs in regions with robust metal recycling networks.
Environmental Regulations Increase Mining Compliance Costs
The U.S. Environmental Protection Agency's 40 CFR Part 436 now enforces zero-liquid-discharge standards for flotation-based fluorspar mills, compelling operators to invest USD 10-15 million in paste-thickening, filter-press, and electro-dewatering systems. China's 2024 safety campaign revoked several small-scale licenses, removing at least 120,000 tons of capacity and tightening world supply. Mongolia's sector faces child-labor red flags, obliging OECD buyers to audit supply chains and sometimes pay certification premiums. Meanwhile, newly finalized PFAS drinking-water limits at 4 ppt for PFOA and PFOS broaden monitoring obligations for fluorochemical sites near aquifers.
Other drivers and restraints analyzed in the detailed report include:
- Battery-Grade Aluminum Fluoride Demand Accelerates
- Semiconductor Industry Drives Ultra-Pure Acidspar Demand
- China Export Controls Create Supply Chain Vulnerabilities
For complete list of drivers and restraints, kindly check the Table Of Contents.
Segment Analysis
Acid-grade material retained a 61.36% fluorspar market share in 2025, anchored by more than or equal to 97% CaF2 specifications essential for hydrofluoric-acid synthesis. This high-purity bench underpins the fluorspar market size for chemical producers that serve refrigeration, aluminum-smelting, and semiconductor etchant channels. Lapidary grade is growing at a 4.23% CAGR on the back of optical-lens demand in laser, lithography, and space-borne sensor systems.
Process upgrades are unlocking grade flexibility. New flotation circuits in China's Hunan province raise low-grade ore from 70% to 95% CaF2, effectively converting ceramic-grade resource into acid-spar feed. Pressure-leaching followed by solvent extraction is similarly lifting recovery at Mexico's Durango mines. Through 2031, acid-grade supply additions in North America could trim the Chinese share of global fluorspar trade from 54% to 47%, modestly diversifying the fluorspar market.
The Fluorspar Report is Segmented by Grade (Acid Grade, Ceramic Grade, Metallurgical Grade, Optical Grade, and Lapidary Grade), Variety (Antozonite, Blue John, Chlorophane, Yttrocerite, and More), Application (Metallurgical, Ceramics, Chemicals, and Other Applications), and Geography (Asia-Pacific, North America, Europe, South America, and Middle-East and Africa). The Market Forecasts are Provided in Terms of Volume (Tons).
Geography Analysis
Asia-Pacific anchored 73.88% of the 2025 fluorspar market volume and is projected to expand at a 2.95% CAGR through 2031, fueled by Chinese acidspar dominance and expanding Indian steel capacity. Japan and South Korea import high-purity material for electronics and EV supply chains, with South Korea advancing electrochemical fluorination to secure indigenous fluorochemical production.
North America is transitioning from near-total import reliance toward partial self-sufficiency. Utah's Lost Sheep mine is slated to deliver 65,000 tons of acidspar in 2026, displacing roughly 10% of current U.S. inbound volumes. Mexico remains the region's workhorse, shipping 1.23 million tons in 2024, equal to 74% of U.S. acidspar imports. Canada's St. Lawrence mine revival will further ease supply risk for battery-grade fluoride once production resumes in 2025.
Spain and South Africa furnish regional material, while Kenyan policy now forbids raw export without in-country processing. Middle-Eastern governments are positioning mining as an economic pillar; Saudi Arabia's 2024 minerals law revision grants 25-year exploitation leases, catalyzing foreign investment in prospective fluorite deposits.
- ARES Strategic Mining Inc.
- Chifeng Sky-Horse Fluorspar Mining Co., Ltd.
- China Kings Resources Group Co., Ltd.
- Erdenes Critical Minerals SOE
- Fluorsid
- Kenya Fluorspar Company Ltd.
- Luoyang Fengrui Fluorine Industry Co., Ltd.
- Masan High-Tech Materials Corporation
- MINERSA GROUP
- Orbia
- Sallies Industrial Minerals
- SepFluor
- Sinochem Group Co., Ltd.
- Steyuan Mineral Resources Group Ltd.
- Yingpeng Chemical Co., Ltd.
Additional Benefits:
- The market estimate (ME) sheet in Excel format
- 3 months of analyst support
TABLE OF CONTENTS
1 Introduction
- 1.1 Study Assumptions and Market Definition
- 1.2 Scope of the Study
2 Research Methodology
3 Executive Summary
4 Market Landscape
- 4.1 Market Overview
- 4.2 Market Drivers
- 4.2.1 Fluorochemicals demand boom (low-GWP refrigerants and fluoropolymers)
- 4.2.2 Rising steel and aluminum output in Asia and MENA
- 4.2.3 Battery-grade aluminum-fluoride demand from Li-ion gigafactories
- 4.2.4 Semiconductor-etching gases require ultra-pure acidspar (under-reported)
- 4.2.5 Western "critical-mineral" onshoring incentives (under-reported)
- 4.3 Market Restraints
- 4.3.1 Stricter environmental and tailings rules on mining
- 4.3.2 China export-quota volatility and freight bottlenecks (under-reported)
- 4.3.3 Substitution by fluorosilicic-acid-derived HF (under-reported)
- 4.4 Value Chain Analysis
- 4.5 Porter's Five Forces
- 4.5.1 Threat of New Entrants
- 4.5.2 Bargaining Power of Buyers
- 4.5.3 Bargaining Power of Suppliers
- 4.5.4 Threat of Substitute Products
- 4.5.5 Degree of Competition
5 Market Size and Growth Forecasts (Volume)
- 5.1 By Grade
- 5.1.1 Acid Grade
- 5.1.2 Ceramic Grade
- 5.1.3 Metallurgical Grade
- 5.1.4 Optical Grade
- 5.1.5 Lapidary Grade
- 5.2 By Variety
- 5.2.1 Antozonite
- 5.2.2 Blue John
- 5.2.3 Chlorophane
- 5.2.4 Yttrocerite
- 5.2.5 Yttrofluorite
- 5.2.6 Other Varieties
- 5.3 By Application
- 5.3.1 Metallurgical
- 5.3.2 Ceramics
- 5.3.3 Chemicals
- 5.3.4 Other Applications (Optical, Glass, Cement, and Coatings)
- 5.4 By Geography
- 5.4.1 Asia-Pacific
- 5.4.1.1 China
- 5.4.1.2 India
- 5.4.1.3 Japan
- 5.4.1.4 South Korea
- 5.4.1.5 Malaysia
- 5.4.1.6 Thailand
- 5.4.1.7 Indonesia
- 5.4.1.8 Vietnam
- 5.4.1.9 Rest of Asia-Pacific
- 5.4.2 North America
- 5.4.2.1 United States
- 5.4.2.2 Canada
- 5.4.2.3 Mexico
- 5.4.3 Europe
- 5.4.3.1 Germany
- 5.4.3.2 United Kingdom
- 5.4.3.3 France
- 5.4.3.4 Italy
- 5.4.3.5 Spain
- 5.4.3.6 Nordic Countries
- 5.4.3.7 Turkey
- 5.4.3.8 Russia
- 5.4.3.9 Rest of Europe
- 5.4.4 South America
- 5.4.4.1 Brazil
- 5.4.4.2 Argentina
- 5.4.4.3 Colombia
- 5.4.4.4 Rest of South America
- 5.4.5 Middle-East and Africa
- 5.4.5.1 Saudi Arabia
- 5.4.5.2 United Arab Emirates
- 5.4.5.3 Qatar
- 5.4.5.4 Nigeria
- 5.4.5.5 Egypt
- 5.4.5.6 South Africa
- 5.4.5.7 Rest of Middle-East and Africa
- 5.4.1 Asia-Pacific
6 Competitive Landscape
- 6.1 Market Concentration
- 6.2 Strategic Moves
- 6.3 Market Share (%)/Ranking Analysis
- 6.4 Company Profiles (includes Global level Overview, Market level overview, Core Segments, Financials as available, Strategic Information, Market Rank/Share for key companies, Products and Services, and Recent Developments)
- 6.4.1 ARES Strategic Mining Inc.
- 6.4.2 Chifeng Sky-Horse Fluorspar Mining Co., Ltd.
- 6.4.3 China Kings Resources Group Co., Ltd.
- 6.4.4 Erdenes Critical Minerals SOE
- 6.4.5 Fluorsid
- 6.4.6 Kenya Fluorspar Company Ltd.
- 6.4.7 Luoyang Fengrui Fluorine Industry Co., Ltd.
- 6.4.8 Masan High-Tech Materials Corporation
- 6.4.9 MINERSA GROUP
- 6.4.10 Orbia
- 6.4.11 Sallies Industrial Minerals
- 6.4.12 SepFluor
- 6.4.13 Sinochem Group Co., Ltd.
- 6.4.14 Steyuan Mineral Resources Group Ltd.
- 6.4.15 Yingpeng Chemical Co., Ltd.
7 Market Opportunities and Future Outlook
- 7.1 White-space and Unmet-need Assessment

