
PUBLISHER: Mordor Intelligence | PRODUCT CODE: 1910832

PUBLISHER: Mordor Intelligence | PRODUCT CODE: 1910832
Fantasy Sports - Market Share Analysis, Industry Trends & Statistics, Growth Forecasts (2026 - 2031)
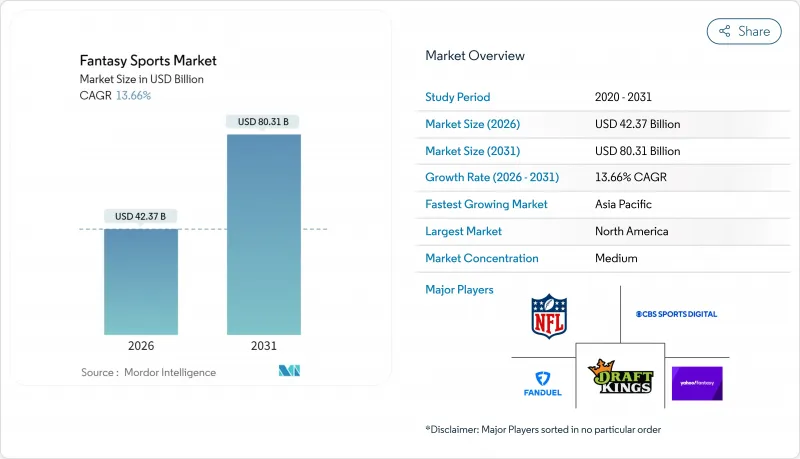
Fantasy sports market size in 2026 is estimated at USD 42.37 billion, growing from 2025 value of USD 37.28 billion with 2031 projections showing USD 80.31 billion, growing at 13.66% CAGR over 2026-2031.
Robust mobile-first adoption, clearer regulations, and increasingly granular data analytics allow operators to convert passive fandom into interactive, skill-based play. The fantasy sports market benefits from multiple revenue streams, entry fees, digital collectibles, advertising, and subscriptions, making it less exposed to any single economic variable. Regulatory normalization in Brazil, incremental liberalization across U.S. states, and systemwide 5G rollout lower barriers to entry while boosting real-time engagement. Meanwhile, platform investments in artificial intelligence and official league data elevate user retention as personalized recommendations strengthen line-up success and perceived fairness.
Global Fantasy Sports Market Trends and Insights
Smartphone-centric user base expansion
Mobile usage represented 65.43% of all fantasy sports transactions in 2024, and the channel is growing at 14.87% CAGR to 2030 as operators optimize push alerts, quick deposits, and geolocation features. PrizePicks crossed 1 million app downloads and supports 15 sports plus 25 leagues via an intuitive design that compresses research and contest entry into seconds. Fifth-generation networks shrink latency to milliseconds, enabling continuous prop-style contests that mirror live game flows. Operators file patents for mid-game roster edits, pointing to proprietary mobile capabilities as an engagement moat. In emerging markets where smartphones are the primary internet device, this mobile-first approach enlarges the fantasy sports market well beyond traditional desktop-reliant demographics.
Legalization of online sports wagering in new jurisdictions
Brazil opened a regulated sports betting framework in January 2025, with annual turnover estimated to reach USD 34 billion by 2028. Regional spillover is underway as Mexico and Argentina evaluate parallel legislation covering skill-based gaming and real-money contests. This creates a timing advantage for first movers that can fast-track compliance and secure advertising partnerships before market saturation. Conversely, California's Attorney General labeled daily fantasy sports illegal in July 2025, adding short-term volatility for operators that must now navigate a patchwork of rules on a state-by-state basis. Firms with seasoned legal teams and modular platform architectures are better positioned to absorb the added compliance cost while scaling into newly open territories.
Regulatory uncertainty and patchwork compliance costs
California's legal reversal spurred lawsuits from Underdog Fantasy and prompted immediate contest suspensions. Germany's GGL has stepped up enforcement under its Interstate Treaty on Gambling, while Malta's Bill 55 complicates cross-border license recognition. Each jurisdiction demands bespoke product tweaks, from payment flows to contest rules, raising legal spend and slowing feature rollouts. Smaller firms lacking dedicated compliance teams face consolidation pressure, giving large incumbents a structural edge.
Other drivers and restraints analyzed in the detailed report include:
- Growing league-led partnerships and official data licensing
- Real-time analytics and AI-driven engagement features
- Data-privacy and integrity concerns
For complete list of drivers and restraints, kindly check the Table Of Contents.
Segment Analysis
American football accounted for 74.92% of the fantasy sports market size in 2025, cementing its hold through deep NFL partnerships and habitual Sunday play. Yet esports is pacing a 14.64% CAGR to 2031 as Gen Z viewers elevate competitive gaming to mainstream status. This surge is unhindered by off-season gaps, offering year-round content cycles. Cricket enjoys outsized traction in India, where Dream11 hosts 210 million users, many drawn during high-profile IPL fixtures. Basketball and baseball preserve sizable pools thanks to player-prop depth and analytics familiarity, while golf and motor racing attract premium entry fees despite smaller audiences. Over the forecast horizon, the fantasy sports market is expected to show more balanced sport participation without eroding football's revenue heft.
Operator responses mirror this diversification. Dedicated esports slates integrate Twitch APIs for live stat pulls, whereas cricket platforms optimize for high-frequency matches that encourage multi-entry play. American football remains the anchor product, but firms now bundle cross-sport promotions to reduce seasonality and lengthen player lifetime value. The endgame is a resilient revenue mix that stabilizes cash flow regardless of any single league's broadcast calendar.
Mobile captured 64.61% of the fantasy sports market share in 2025, a lead reinforced by 14.21% CAGR projections tied to faster chipsets and biometric login convenience. The desktop cohort sticks around for research-heavy tasks, but second-screen culture prioritizes the phone for contest entry and live sweats. Smart-TV integration is nascent; yet Amazon's rights portfolio implies future scenarios where viewers draft prop picks straight from the remote. Cloud-synced accounts let users toggle across devices without losing lineup edits, sharpening overall retention.
Mobile-centric product roadmaps also lower barriers in geographies where PCs are scarce, amplifying reach in Southeast Asia and Latin America. Operators compete on load speeds, UX clarity, and one-tap deposits, distinguishing themselves in an ecosystem where app-store ratings translate directly into acquisition velocity. The fantasy sports market therefore hinges on continued mobile OS innovation and affordable data plans that keep latency and transaction costs minimal.
The Fantasy Sports Market Report is Segmented by Sport Type (American Football, Basketball, Baseball, and More), Platform (Website, Mobile Application, and Smart TV/Console), Contest Format (Season-Long Fantasy, Daily Fantasy, and More), Revenue Model (Entry-Fee Based, Advertising-Supported Free-To-Play, Subscription-Based, NFT/Token-gated), and Geography. The Market Forecasts are Provided in Terms of Value (USD).
Geography Analysis
North America sustained 38.22% fantasy sports market share in 2025, anchored by U.S. user familiarity and premium contest entry levels. Recent legal volatility in California underscores that maturity does not equal stability. Canada's lighter federal oversight and Mexico's pending legislation present near-term white space, while U.S. operators refine loyalty programs to offset soaring acquisition spend that reached USD 416 million in TV buys during 2024.
Asia Pacific is pacing a 13.72% CAGR to 2031, catalyzed by India's cricket-centric user base and expanding 4G penetration. Dream11's 210 million accounts show the scale potential when local sports passions and inexpensive data converge. Despite a 28% GST on entry fees, operators leverage regional payment gateways and vernacular content to sustain growth. China's opportunity hinges on policy clarity, but Japan and Australia already furnish regulated pathways with high per-capita spend.
Europe offers mixed prospects. Germany's strict ISTG regime raises compliance hurdles, whereas the UK remains sizable but constrained by ad-spend caps and data-privacy audits. Latin America, led by Brazil's newly regulated wagering ecosystem, promises rapid expansion; projected turnover of USD 34 billion by 2028 signals ample liquidity for parallel fantasy offerings. Argentina and Mexico could unlock another 50 million prospects once frameworks solidify. Africa and the Middle East stay on long-term watchlists given infrastructural and legislative gaps, yet rising smartphone adoption makes future entry feasible once regulatory guardrails appear.
- DraftKings Inc.
- FanDuel Group (Flutter Entertainment plc)
- CBS Interactive Inc. (CBS Sports Digital)
- Yahoo Inc. (Yahoo Fantasy Sports)
- ESPN Enterprises, Inc.
- NFL Enterprises LLC
- Sleeper, Inc.
- Dream Sports Inc.
- RealTime Fantasy Sports Inc.
- Bovada (Morris Mohawk Gaming Group)
- Low6 Ltd.
- Vauntek Inc. (Fantrax)
- Sorare SAS
- MyTeam11 Fantasy Sports Pvt. Ltd.
- Games24x7 Pvt. Ltd. (My11Circle)
- Galactus Funware Technology Pvt. Ltd. (Mobile Premier League)
- PlayON Ltd.
- PlayUp Ltd.
- MKF Holdings LLC (Monkey Knife Fight)
- BalleBaazi Games Pvt. Ltd.
- PrizePicks (Performance Predictions LLC)
- Underdog Sports Holdings LLC
Additional Benefits:
- The market estimate (ME) sheet in Excel format
- 3 months of analyst support
TABLE OF CONTENTS
1 INTRODUCTION
- 1.1 Study Assumptions and Market Definition
- 1.2 Scope of the Study
2 RESEARCH METHODOLOGY
3 EXECUTIVE SUMMARY
4 MARKET LANDSCAPE
- 4.1 Market Overview
- 4.2 Market Drivers
- 4.2.1 Smartphone-centric user base expansion
- 4.2.2 Legalization of online sports wagering in new jurisdictions
- 4.2.3 Growing league-led partnerships and official data licensing
- 4.2.4 Real-time analytics and AI-driven engagement features
- 4.2.5 Web3-enabled play-to-earn and digital collectibles integration
- 4.2.6 Rise of female fan participation and gender-inclusive marketing
- 4.3 Market Restraints
- 4.3.1 Regulatory uncertainty and patchwork compliance costs
- 4.3.2 Data-privacy and integrity concerns
- 4.3.3 Escalating customer-acquisition spending pressures
- 4.3.4 Player fatigue from contest saturation and screen time
- 4.4 Regulatory Landscape
- 4.5 Technological Outlook
- 4.6 Porter's Five Forces Analysis
- 4.6.1 Bargaining Power of Suppliers
- 4.6.2 Bargaining Power of Buyers
- 4.6.3 Threat of New Entrants
- 4.6.4 Threat of Substitute Products
- 4.6.5 Intensity of Competitive Rivalry
- 4.7 Investment Analysis
5 MARKET SIZE AND GROWTH FORECASTS (VALUE)
- 5.1 By Sport Type
- 5.1.1 American Football
- 5.1.2 Basketball
- 5.1.3 Baseball
- 5.1.4 Cricket
- 5.1.5 Soccer
- 5.1.6 Motor Racing
- 5.1.7 Golf
- 5.1.8 Esports
- 5.1.9 Other Sport Types
- 5.2 By Platform
- 5.2.1 Website
- 5.2.2 Mobile Application
- 5.2.3 Smart TV / Console
- 5.3 By Contest Format
- 5.3.1 Season-long Fantasy
- 5.3.2 Daily Fantasy (DFS)
- 5.3.3 Micro / In-play Fantasy
- 5.3.4 Best-Ball
- 5.4 By Revenue Model
- 5.4.1 Entry-fee Based
- 5.4.2 Advertising-supported Free-to-Play
- 5.4.3 Subscription-based
- 5.4.4 NFT / Token-gated
- 5.5 By Geography
- 5.5.1 North America
- 5.5.1.1 United States
- 5.5.1.2 Canada
- 5.5.1.3 Mexico
- 5.5.2 South America
- 5.5.2.1 Brazil
- 5.5.2.2 Argentina
- 5.5.2.3 Rest of South America
- 5.5.3 Europe
- 5.5.3.1 United Kingdom
- 5.5.3.2 Germany
- 5.5.3.3 France
- 5.5.3.4 Italy
- 5.5.3.5 Spain
- 5.5.3.6 Russia
- 5.5.3.7 Rest of Europe
- 5.5.4 Asia Pacific
- 5.5.4.1 China
- 5.5.4.2 India
- 5.5.4.3 Japan
- 5.5.4.4 South Korea
- 5.5.4.5 Australia and New Zealand
- 5.5.4.6 Rest of Asia Pacific
- 5.5.5 Middle East and Africa
- 5.5.5.1 Middle East
- 5.5.5.1.1 Saudi Arabia
- 5.5.5.1.2 United Arab Emirates
- 5.5.5.1.3 Turkey
- 5.5.5.1.4 Rest of Middle East
- 5.5.5.2 Africa
- 5.5.5.2.1 South Africa
- 5.5.5.2.2 Nigeria
- 5.5.5.2.3 Egypt
- 5.5.5.2.4 Rest of Africa
- 5.5.5.1 Middle East
- 5.5.1 North America
6 COMPETITIVE LANDSCAPE
- 6.1 Market Concentration
- 6.2 Strategic Moves
- 6.3 Market Share Analysis
- 6.4 Company Profiles (includes Global level Overview, Market level overview, Core Segments, Financials as available, Strategic Information, Market Rank/Share for key companies, Products and Services, and Recent Developments)
- 6.4.1 DraftKings Inc.
- 6.4.2 FanDuel Group (Flutter Entertainment plc)
- 6.4.3 CBS Interactive Inc. (CBS Sports Digital)
- 6.4.4 Yahoo Inc. (Yahoo Fantasy Sports)
- 6.4.5 ESPN Enterprises, Inc.
- 6.4.6 NFL Enterprises LLC
- 6.4.7 Sleeper, Inc.
- 6.4.8 Dream Sports Inc.
- 6.4.9 RealTime Fantasy Sports Inc.
- 6.4.10 Bovada (Morris Mohawk Gaming Group)
- 6.4.11 Low6 Ltd.
- 6.4.12 Vauntek Inc. (Fantrax)
- 6.4.13 Sorare SAS
- 6.4.14 MyTeam11 Fantasy Sports Pvt. Ltd.
- 6.4.15 Games24x7 Pvt. Ltd. (My11Circle)
- 6.4.16 Galactus Funware Technology Pvt. Ltd. (Mobile Premier League)
- 6.4.17 PlayON Ltd.
- 6.4.18 PlayUp Ltd.
- 6.4.19 MKF Holdings LLC (Monkey Knife Fight)
- 6.4.20 BalleBaazi Games Pvt. Ltd.
- 6.4.21 PrizePicks (Performance Predictions LLC)
- 6.4.22 Underdog Sports Holdings LLC
7 MARKET OPPORTUNITIES AND FUTURE OUTLOOK
- 7.1 White-space and Unmet-need Assessment

