
PUBLISHER: Mordor Intelligence | PRODUCT CODE: 1910849

PUBLISHER: Mordor Intelligence | PRODUCT CODE: 1910849
Gaming Accessories - Market Share Analysis, Industry Trends & Statistics, Growth Forecasts (2026 - 2031)
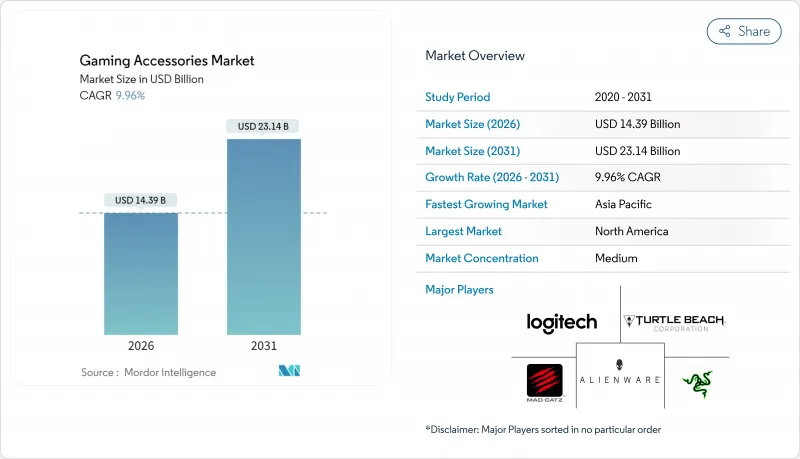
The gaming accessories market is expected to grow from USD 13.09 billion in 2025 to USD 14.39 billion in 2026 and is forecast to reach USD 23.14 billion by 2031 at 9.96% CAGR over 2026-2031.
This trajectory captured the sector's transition from simple peripherals toward software-integrated ecosystems that united play, productivity, and content creation. Growth had been driven by the professionalization of esports, the rise of cloud gaming platforms that reduced hardware barriers, and the first wave of AI-powered peripherals that demanded low-latency interfaces. Manufacturers also responded to rising cross-platform engagement by building universal compatibility into design roadmaps, while haptic feedback and early neural-interface research pushed accessories beyond passive input toward active sensory feedback. Strategic moves-such as Corsair's September 2024 acquisition of Fanatec-demonstrated how leading firms pursued vertical integration to secure differentiated technologies and supply-chain control.
Global Gaming Accessories Market Trends and Insights
Surge in Global Gamer Population and Esports Viewership
Competitive gaming participation had soared and transformed premium peripherals into mainstream expectations. When global esports revenue approached USD 4.3 billion in 2024, livestreamed tournaments showcased professional setups that casual players emulated.Educational institutions likewise adopted standardized equipment, embedding high-performance headsets, keyboards, and mice into curricula. This professionalization placed millisecond-level precision at the center of purchasing decisions and sustained demand for low-latency interfaces. The demonstration effect widened the addressable base and lengthened replacement cycles as performance-oriented amateurs sought tournament-grade technology.
Continuous Product Innovation (RGB, Haptics, Wireless)
Peripherals evolved past ornamental features into functional performance drivers. Wireless headsets and mice delivered wired-class latency, freeing desk space and improving ergonomics. Haptic feedback advanced beyond vibration; research teams at Northwestern Engineering unveiled flexible wireless devices that simulated twisting and pressure sensations, opening paths to richer spatial awareness in games. RGB lighting moved from decoration to real-time telemetry, signaling game status or device health. For manufacturers, such layered functionality prolonged product relevance in a market where commoditization pressure shortened lifecycles.
High Import Tariffs on Electronics
Trade tensions imposed sudden cost hikes on gaming hardware. In April 2025 the Nintendo Switch 2 incurred a 46% United States tariff when assembled in Vietnam, while Japanese game cards faced 24% duties. Accessory makers redirected production to tariff-free hubs, raising logistics complexity and inventory risk. The Consumer Technology Association warned that higher duties could erode American purchasing power by as much as USD 143 billion annually, curbing discretionary spending on peripherals. Some niche brands, such as 8BitDo, halted United States warehouse shipments, leaving constrained domestic stocks and pushing prices upward.
Other drivers and restraints analyzed in the detailed report include:
- Expansion of Cloud Gaming and Cross-Platform Ecosystems
- Growing Disposable Income in Emerging Economies
- Product Commoditization and Short Replacement Cycles
For complete list of drivers and restraints, kindly check the Table Of Contents.
Segment Analysis
Headsets captured 27.92% gaming accessories market share in 2025 as directional audio and clear voice chat remained decisive in competitive play. The segment's dominance had been reinforced by noise-canceling microphones and spatial-sound firmware that mimicked tournament conditions. Gaming chairs showed an 11.02% CAGR to 2031, propelled by workplace-safety rules that mandated ergonomic seating for streamers and content creators who spent extended hours online. Keyboard and mouse categories held steady as established staples, with optical-switch advancements trimming actuation times. Controllers, mouse pads, and cable-management kits filled ecosystem needs and leveraged cross-selling. Razer's 2025 Skibidi headset, with on-board AI language translation, signaled the next frontier where software features rather than raw drivers defined value.
Immersive seating followed a similar trajectory; Project Carol prototypes integrated near-field surround sound and haptics directly into chair headrests, elevating furniture from passive support into sensory portals. Such innovations hinted that future differentiation would revolve around firmware updates, cloud-linked profiles, and machine-learning-driven personalization, extending product life and fostering subscription add-ons.
PC peripherals held 43.25% share of the gaming accessories market size in 2025, benefiting from content-creation workflows that demanded macro-rich keyboards and adjustable-weight mice. Yet mobile-focused gear recorded a 12.11% CAGR through 2031, backed by competitive smartphone titles and telco-sponsored leagues. Console accessories maintained stable demand tied to the PlayStation and Xbox installed bases, while cross-platform devices gained traction among households juggling multiple gaming endpoints. The gaming accessories market experienced tightening latency requirements as cloud platforms compressed response envelopes, spurring investment in high-polling-rate wireless dongles that worked interchangeably across PC rigs, handheld consoles, and smart TVs.
Manufacturers bundled firmware suites that detected host systems and reconfigured sensitivity curves on the fly. Logitech's 2024 MX Ink stylus, built for Meta Quest, illustrated how hybrid creative-gaming use cases blurred device lines. Looking ahead, PC strongholds could erode if cloud services fully decoupled local processing from input responsiveness.
The Gaming Accessories Market Report is Segmented by Product Type (Headsets, Gaming Keyboards, Gaming Mice, and More), Device Compatibility (PC, Console, Mobile, Cross-Platform/Universal), Distribution Channel (Online Retail, Offline Retail), Price Range (Economy (Less Than USD 51), Mid-Range (USD 51-150), Premium (Above USD 150)), and Geography. The Market Forecasts are Provided in Terms of Value (USD).
Geography Analysis
North America's 31.74% hold in 2025 had reflected a cohesive esports infrastructure, strong sponsorship funding, and entrenched streaming-creator cultures. Retailers benefited from coordinated launch calendars that leveraged influencer unboxings to accelerate sell-through. Tariff shocks raised landed costs in 2025, prompting inventory pooling and just-in-time restocks to minimize capital locks.
Asia Pacific's double-digit CAGR owed much to China's manufacturing ecosystem, which tightened design-to-delivery cycles, and to Southeast Asia's robust mobile esports scene. Government support for tech parks in India and Malaysia fostered accessory start-ups that targeted localized aesthetics and budget ranges. Regional telcos bundled game-pass subscriptions with 5G contracts, driving controller sales bundled in welcome kits.
Europe's market matured around ergonomic compliance. Germany enforced chair safety certifications that became de facto global benchmarks. Nordic countries prioritized sustainable materials, influencing worldwide sourcing standards. Latin American gamers gravitated toward mid-range wired devices due to higher import duties on lithium-battery products, although Argentina and Brazil began hosting regional tournaments that spurred headset upgrades. In the Middle East and Africa, premium console sales catalyzed accessory pull-through, particularly during Ramadan promotional seasons when retailers widened installment-payment options.
- Corsair Gaming, Inc.
- Logitech International S.A.
- Razer Inc.
- Turtle Beach Corporation
- Kingston Technology Company, Inc. (HyperX)
- Sony Group Corporation (PlayStation Accessories)
- Microsoft Corporation (Xbox Accessories)
- SteelSeries ApS (GN Store Nord A/S)
- Cooler Master Technology Inc.
- Anker Innovations Limited
- Thermaltake Technology Co., Ltd.
- ASUS Tek Computer Inc. (ROG)
- Acer Inc. (Predator)
- Dell Technologies Inc. (Alienware)
- Lenovo Group Limited (Legion)
- HP Inc. (OMEN)
- Mad Catz Global Limited
- PDP Performance Designed Products LLC
- Hyperkin Inc.
- Scuf Gaming International, LLC
Additional Benefits:
- The market estimate (ME) sheet in Excel format
- 3 months of analyst support
TABLE OF CONTENTS
1 INTRODUCTION
- 1.1 Study Assumptions and Market Definition
- 1.2 Scope of the Study
2 RESEARCH METHODOLOGY
3 EXECUTIVE SUMMARY
4 MARKET LANDSCAPE
- 4.1 Market Overview
- 4.2 Market Drivers
- 4.2.1 Surge in global gamer population and e-sports viewership
- 4.2.2 Continuous product innovation (RGB, haptics, wireless)
- 4.2.3 Expansion of cloud gaming and cross-platform ecosystems
- 4.2.4 Growing disposable income in emerging economies
- 4.2.5 Ergonomic regulations spurring demand for gaming chairs
- 4.2.6 Aesthetic-centric accessories for female gamer segment
- 4.3 Market Restraints
- 4.3.1 High import tariffs on electronics
- 4.3.2 Product commoditization and short replacement cycles
- 4.3.3 Semiconductor and sensor supply-chain constraints
- 4.3.4 E-waste policies increasing compliance costs
- 4.4 Industry Value Chain Analysis
- 4.5 Technological Outlook
- 4.6 Regulatory Landscape
- 4.7 Porter's Five Forces Analysis
- 4.7.1 Threat of New Entrants
- 4.7.2 Bargaining Power of Suppliers
- 4.7.3 Bargaining Power of Buyers
- 4.7.4 Threat of Substitutes
- 4.7.5 Intensity of Competitive Rivalry
5 MARKET SIZE AND GROWTH FORECASTS (VALUE)
- 5.1 By Product Type
- 5.1.1 Headsets
- 5.1.2 Gaming Keyboards
- 5.1.3 Gaming Mice
- 5.1.4 Gamepads / Controllers
- 5.1.5 Gaming Chairs
- 5.1.6 Other Product Types
- 5.2 By Device Compatibility
- 5.2.1 PC
- 5.2.2 Console
- 5.2.3 Mobile
- 5.2.4 Cross-Platform / Universal
- 5.3 By Distribution Channel
- 5.3.1 Online Retail
- 5.3.2 Offline Retail
- 5.3.2.1 Specialty Gaming Stores
- 5.3.2.2 Consumer Electronics Stores
- 5.3.2.3 Hypermarkets and Supermarkets
- 5.4 By Price Range
- 5.4.1 Economy (Less Than USD 51)
- 5.4.2 Mid-Range (USD 51 - USD 150)
- 5.4.3 Premium (Above USD 150)
- 5.5 By Geography
- 5.5.1 North America
- 5.5.1.1 United States
- 5.5.1.2 Canada
- 5.5.1.3 Mexico
- 5.5.2 South America
- 5.5.2.1 Brazil
- 5.5.2.2 Argentina
- 5.5.2.3 Rest of South America
- 5.5.3 Europe
- 5.5.3.1 Germany
- 5.5.3.2 United Kingdom
- 5.5.3.3 France
- 5.5.3.4 Spain
- 5.5.3.5 Italy
- 5.5.3.6 Russia
- 5.5.3.7 Rest of Europe
- 5.5.4 Asia Pacific
- 5.5.4.1 China
- 5.5.4.2 Japan
- 5.5.4.3 South Korea
- 5.5.4.4 India
- 5.5.4.5 Australia
- 5.5.4.6 Rest of Asia Pacific
- 5.5.5 Middle East and Africa
- 5.5.5.1 Middle East
- 5.5.5.1.1 United Arab Emirates
- 5.5.5.1.2 Saudi Arabia
- 5.5.5.1.3 Turkey
- 5.5.5.1.4 Rest of Middle East
- 5.5.5.2 Africa
- 5.5.5.2.1 South Africa
- 5.5.5.2.2 Nigeria
- 5.5.5.2.3 Rest of Africa
- 5.5.5.1 Middle East
- 5.5.1 North America
6 COMPETITIVE LANDSCAPE
- 6.1 Market Concentration
- 6.2 Strategic Moves
- 6.3 Market Share Analysis
- 6.4 Company Profiles (includes Global level Overview, Market level overview, Core Segments, Financials as available, Strategic Information, Market Rank/Share for key companies, Products and Services, and Recent Developments)
- 6.4.1 Corsair Gaming, Inc.
- 6.4.2 Logitech International S.A.
- 6.4.3 Razer Inc.
- 6.4.4 Turtle Beach Corporation
- 6.4.5 Kingston Technology Company, Inc. (HyperX)
- 6.4.6 Sony Group Corporation (PlayStation Accessories)
- 6.4.7 Microsoft Corporation (Xbox Accessories)
- 6.4.8 SteelSeries ApS (GN Store Nord A/S)
- 6.4.9 Cooler Master Technology Inc.
- 6.4.10 Anker Innovations Limited
- 6.4.11 Thermaltake Technology Co., Ltd.
- 6.4.12 ASUS Tek Computer Inc. (ROG)
- 6.4.13 Acer Inc. (Predator)
- 6.4.14 Dell Technologies Inc. (Alienware)
- 6.4.15 Lenovo Group Limited (Legion)
- 6.4.16 HP Inc. (OMEN)
- 6.4.17 Mad Catz Global Limited
- 6.4.18 PDP Performance Designed Products LLC
- 6.4.19 Hyperkin Inc.
- 6.4.20 Scuf Gaming International, LLC
7 MARKET OPPORTUNITIES AND FUTURE OUTLOOK
- 7.1 White-space and Unmet-Need Assessment

