
PUBLISHER: Mordor Intelligence | PRODUCT CODE: 1910862

PUBLISHER: Mordor Intelligence | PRODUCT CODE: 1910862
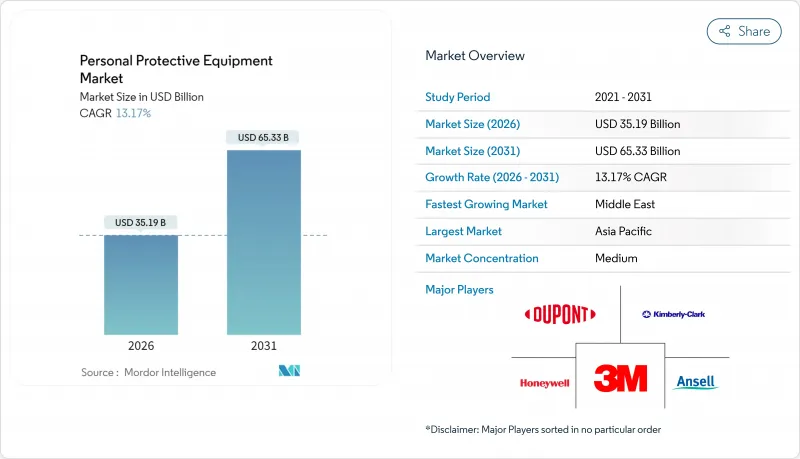
Personal Protective Equipment - Market Share Analysis, Industry Trends & Statistics, Growth Forecasts (2026 - 2031)
The personal protective equipment market is expected to grow from USD 31.10 billion in 2025 to USD 35.19 billion in 2026 and is forecast to reach USD 65.33 billion by 2031 at 13.17% CAGR over 2026-2031.
Continuous regulatory tightening, higher employer liability exposure, and a widespread corporate commitment to zero-harm cultures are propelling demand across both mature and emerging economies. Rapid miniaturisation of sensors, falling connectivity costs, and increased cloud analytics adoption are turning formerly passive gear into data-rich safety nodes, sharpening the value proposition beyond basic protection. Mounting sustainability expectations are reshaping material choices and lifecycle models, while consolidation among tier-one suppliers is realigning bargaining power across the value chain. Collectively, these forces position the personal protective equipment market for sustained double-digit expansion during the second half of the decade.
Global Personal Protective Equipment Market Trends and Insights
Accelerated workplace-safety mandates in Asian manufacturing hubs
China's updated Work Safety Law obliges high-risk sectors to deploy connected PPE that streams exposure data in real time, boosting premium-grade demand across the region . India's Occupational Safety, Health and Working Conditions Code is generating similar momentum, prompting Mallcom to invest INR 100 crore (USD 12 million) to expand domestic capacity. Local suppliers are therefore pivoting from low-cost competition toward performance differentiation, raising average selling prices and tightening compliance across supply chains.
Stricter EU ecodesign and circularity rules for disposable PPE
The EU's new Extended Producer Responsibility schemes force manufacturers to finance end-of-life collection and recycling of masks and gloves, accelerating R&D in biodegradable polymers. Early pilot programs have recovered up to 60% of materials in single-use categories, turning compliance into a branding advantage for companies such as UVEX and 3M Deutschland.
Environmental Push-Back on Single-Use Synthetic Polymers in Europe
Healthcare alone has doubled disposable PPE use since 2005, amplifying landfill pressures and carbon footprints. Advocacy groups now spotlight the climate impact of petro-chemical gloves and masks, prompting hospitals to insert sustainability clauses into tender documents. Alternatives such as bio-based polyhydroxyalkanoate gloves are promising but still cost a premium and struggle to meet stringent filtration or tensile requirements. Manufacturers therefore face a profitability squeeze as they pursue parallel R&D paths while maintaining current production lines to satisfy mandatory performance standards. The net effect is a medium-to-long-term drag on margin expansion, particularly for firms heavily weighted toward high-volume disposables.
Other drivers and restraints analyzed in the detailed report include:
- Rapid digitalisation of industrial PPE procurement via B2B marketplaces in North America
- Integration of IoT-enabled smart PPE for real-time worker monitoring in oil and gas
- Volatile Nitrile and Latex Prices Disrupting Glove Supply Economics
For complete list of drivers and restraints, kindly check the Table Of Contents.
Segment Analysis
Respiratory Protection is projected to grow at a 12.48% CAGR through 2031, powered by smart filters with embedded biometric sensors that warn users of abnormal breathing patterns. Gloves retained 28.82% personal protective equipment market share in 2025, supported by cut-resistant fibres and touchscreen-compatible coatings that suit digital shop-floor workflows.
Design improvements now emphasise breathability and weight reduction; Johns Hopkins experts recommend investment in reusable elastomeric respirators to replace legacy single-use models. As buyers evaluate gear on lifecycle cost rather than ticket price, premium variants-often IoT-enabled-are gaining shelf space across institutional and e-commerce channels.
The Personal Protective Equipment (PPE) Market Report is Segmented by Product (Masks, Respirators, Gloves, Suits, Eyewear, Footwear, Helmets, Fall Protection), End-User Industry (Healthcare, Manufacturing, Construction, and More), Distribution Channel (Direct Contracts, Distributors, E-Commerce, Retail), and Geography. The Market Forecasts are Provided in Terms of Value (USD).
Geography Analysis
Asia-Pacific held 39.05% of the personal protective equipment market in 2025, underwritten by its outsized manufacturing footprint and expanding construction pipeline. China's chemical, electronics, and ship-building clusters drive bulk orders, while India's medical-device sector is on track to reach USD 20.51 billion by 2029, boosting domestic demand for cleanroom-grade consumables. Governments are scaling fiscal incentives for local PPE production, reducing import dependence and enhancing supply-chain resilience.
North America maintains a robust position characterised by stringent OSHA oversight and early adoption of smart PPE in oil and gas and healthcare. Federal funding for semiconductor expansion is set to lift demand for contamination-control garments, reinforcing the region's premium-product bias. Europe's market is pivoting toward eco-compliance, with circularity deadlines pressuring suppliers to offer take-back schemes and recycled-content portfolios. These sustainability prerequisites act as soft trade barriers that encourage regional sourcing.
The Middle East is the fastest-growing pocket, forecast at a 13.86% CAGR to 2031 on the back of USD 2 trillion worth of mega-projects across Saudi Arabia and the UAE. National regulations now require internationally certified PPE for site workers, opening avenues for premium brands. South America exhibits uneven adoption; Brazil is raising enforcement after high-profile industrial incidents, while fiscal constraints temper acceleration elsewhere. Africa presents a long-horizon opportunity: industrialisation and mining expansion are stepping up enforcement of safety codes, yet supply chains remain nascent, favouring first movers able to localise last-mile distribution.
- 3M Company
- Honeywell International Inc.
- Ansell Ltd
- DuPont de Nemours Inc.
- Kimberly-Clark Corporation
- Cardinal Health Inc.
- Top Glove Corporation Bhd
- MSA Safety Inc.
- Lakeland Industries
- Alpha Pro Tech Ltd.
- Protective Industrial Products (PIP)
- Delta Plus Group
- Dragerwerk AG and Co. KGaA
- JSP Ltd.
- Uvex Safety Group GmbH
- COFRA S.r.l.
- Showa Group
- Radians Inc.
- Bullard
- Moldex-Metric Inc.
Additional Benefits:
- The market estimate (ME) sheet in Excel format
- 3 months of analyst support
TABLE OF CONTENTS
1 INTRODUCTION
- 1.1 Study Assumptions and Market Definition
- 1.2 Scope of the Study
2 RESEARCH METHODOLOGY
3 EXECUTIVE SUMMARY
4 MARKET LANDSCAPE
- 4.1 Market Drivers
- 4.1.1 Accelerated Workplace-Safety Mandates in Asian Manufacturing Hubs
- 4.1.2 Stricter EU Ecodesign and Circularity Rules for Disposable PPE
- 4.1.3 Rapid Digitalisation of Industrial PPE Procurement via B2B Marketplaces in North America
- 4.1.4 Integration of IoT-Enabled Smart PPE for Real-Time Worker Monitoring in Oil and Gas
- 4.1.5 Boom in Clean-Room Expansion for Semiconductor Fabs (Respiratory and Garment Demand)
- 4.1.6 Defence Modernisation Programs Driving Military-Grade Ballistic PPE in Middle East
- 4.2 Market Restraints
- 4.2.1 Environmental Push-back on Single-Use Synthetic Polymers in Europe
- 4.2.2 Volatile Nitrile and Latex Prices Disrupting Glove Supply Economics
- 4.2.3 Compliance Fatigue Among SMEs in Emerging Markets
- 4.2.4 Fragmented Certification Standards Hindering Cross-border Trade
- 4.3 Value / Supply-Chain Analysis
- 4.4 Regulatory Outlook
- 4.5 Technological Outlook
- 4.6 Porter's Five Forces
- 4.6.1 Bargaining Power of Suppliers
- 4.6.2 Bargaining Power of Buyers
- 4.6.3 Threat of New Entrants
- 4.6.4 Threat of Substitutes
- 4.6.5 Intensity of Competitive Rivalry
- 4.7 Assessment of the Impact of COVID-19
- 4.7.1 Production Dynamics - Pure-Play vs. Diversified Vendors
- 4.7.2 Import/Export Regulation Shifts
- 4.7.3 Top 10 PPE Importing and Exporting Countries
- 4.8 Investment Analysis
5 MARKET SIZE AND GROWTH FORECASTS (VALUE)
- 5.1 By Product
- 5.1.1 Surgical Masks
- 5.1.2 Respirator Masks
- 5.1.2.1 N-Series (N95, N99, N100)
- 5.1.2.2 P-Series (P95, P99, P100)
- 5.1.2.3 R-Series (R95, R99, R100)
- 5.1.2.4 FFP1
- 5.1.2.5 FFP2
- 5.1.2.6 FFP3
- 5.1.3 Gloves
- 5.1.3.1 Disposable (Latex)
- 5.1.3.2 Disposable (Nitrile)
- 5.1.3.3 Industrial Re-usable
- 5.1.4 Suits and Coveralls
- 5.1.5 Aprons and Gowns
- 5.1.6 Protective Eyewear and Face Shields
- 5.1.7 Hearing Protection
- 5.1.7.1 Earplugs
- 5.1.7.2 Earmuffs
- 5.1.8 Protective Footwear
- 5.1.8.1 Safety Shoes
- 5.1.8.2 Rubber Boots
- 5.1.9 Helmets and Hard Hats
- 5.1.10 Fall Protection
- 5.1.10.1 Harnesses and Lanyards
- 5.1.11 Fire-Resistant and Arc-Flash Clothing
- 5.2 By End-User Industry
- 5.2.1 Healthcare and Life Sciences
- 5.2.2 Manufacturing (Heavy and Light)
- 5.2.3 Construction and Infrastructure
- 5.2.4 Oil and Gas, Mining and Metals
- 5.2.5 Chemicals and Pharmaceuticals
- 5.2.6 Food and Beverage Processing
- 5.2.7 Transportation and Logistics
- 5.2.8 Military, Law Enforcement and Homeland Security
- 5.3 By Distribution Channel
- 5.3.1 Direct Institutional Contracts
- 5.3.2 Industrial Distributors and Wholesalers
- 5.3.3 E-commerce and Digital Marketplaces
- 5.3.4 Retail (DIY and Hardware Stores)
- 5.4 By Geography
- 5.4.1 North America
- 5.4.1.1 United States
- 5.4.1.2 Canada
- 5.4.1.3 Mexico
- 5.4.2 South America
- 5.4.2.1 Brazil
- 5.4.2.2 Argentina
- 5.4.2.3 Rest of South America
- 5.4.3 Europe
- 5.4.3.1 Germany
- 5.4.3.2 France
- 5.4.3.3 United Kingdom
- 5.4.3.4 Italy
- 5.4.3.5 Spain
- 5.4.3.6 Nordics (Sweden, Norway, Denmark, Finland, Iceland)
- 5.4.3.7 Benelux (Netherlands, Belgium, Luxembourg)
- 5.4.3.8 Central and Eastern Europe (Poland, Czech Republic, Russia, Others)
- 5.4.4 Middle East and Africa
- 5.4.4.1 Saudi Arabia
- 5.4.4.2 United Arab Emirates
- 5.4.4.3 Turkey
- 5.4.4.4 South Africa
- 5.4.4.5 Nigeria
- 5.4.4.6 Kenya
- 5.4.4.7 Rest of Middle East and Africa
- 5.4.5 APAC
- 5.4.5.1 China
- 5.4.5.2 Japan
- 5.4.5.3 India
- 5.4.5.4 South Korea
- 5.4.5.5 ASEAN-5 (Indonesia, Thailand, Malaysia, Vietnam, Philippines)
- 5.4.5.6 Australia
- 5.4.5.7 New Zealand
- 5.4.5.8 Rest of APAC
- 5.4.1 North America
6 COMPETITIVE LANDSCAPE
- 6.1 Market Concentration
- 6.2 Strategic Moves
- 6.3 Market Share Analysis
- 6.4 Company Profiles (includes Global-level Overview, Market-level Overview, Core Segments, Financials as available, Strategic Information, Market Rank/Share, Products and Services, Recent Developments)
- 6.4.1 3M Company
- 6.4.2 Honeywell International Inc.
- 6.4.3 Ansell Ltd
- 6.4.4 DuPont de Nemours Inc.
- 6.4.5 Kimberly-Clark Corporation
- 6.4.6 Cardinal Health Inc.
- 6.4.7 Top Glove Corporation Bhd
- 6.4.8 MSA Safety Inc.
- 6.4.9 Lakeland Industries
- 6.4.10 Alpha Pro Tech Ltd.
- 6.4.11 Protective Industrial Products (PIP)
- 6.4.12 Delta Plus Group
- 6.4.13 Dragerwerk AG and Co. KGaA
- 6.4.14 JSP Ltd.
- 6.4.15 Uvex Safety Group GmbH
- 6.4.16 COFRA S.r.l.
- 6.4.17 Showa Group
- 6.4.18 Radians Inc.
- 6.4.19 Bullard
- 6.4.20 Moldex-Metric Inc.
7 MARKET OPPORTUNITIES AND FUTURE OUTLOOK
- 7.1 White-Space and Unmet-Need Assessment

