
PUBLISHER: Mordor Intelligence | PRODUCT CODE: 1910917

PUBLISHER: Mordor Intelligence | PRODUCT CODE: 1910917
Media Streaming - Market Share Analysis, Industry Trends & Statistics, Growth Forecasts (2026 - 2031)
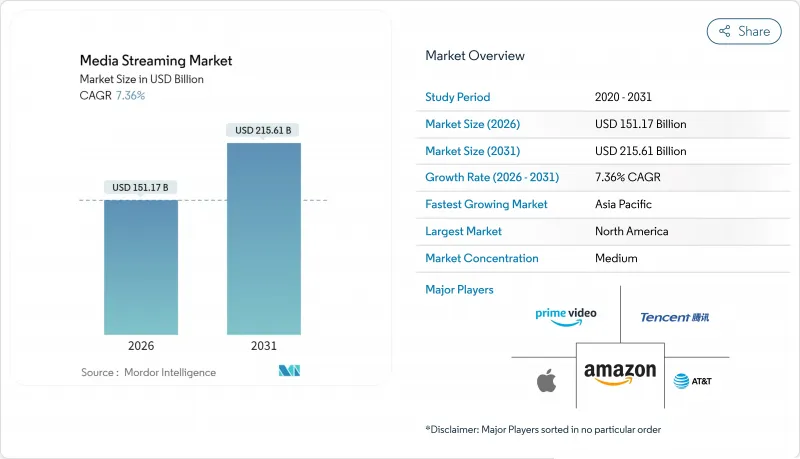
The media streaming market was valued at USD 140.80 billion in 2025 and estimated to grow from USD 151.17 billion in 2026 to reach USD 215.61 billion by 2031, at a CAGR of 7.36% during the forecast period (2026-2031).
This strong outlook rests on a decisive pivot from subscription-only propositions toward hybrid monetization that combines paid tiers with advertising inventory, enabling platforms to offset rising customer-acquisition costs and improve profitability. Competitive differentiation increasingly stems from control of advertising technology stacks, real-time recommendation engines, and exclusive content rights that secure premium pricing. Network upgrades-in particular 5G rollouts-support higher-bitrate delivery, while edge compute adoption cuts latency, allowing 4K and 8K streams to reach mobile users without buffering. Sports rights fragmentation drives event-led subscriber spikes and higher CPMs, whereas localized content libraries draw new viewers in under-penetrated rural markets. At the same time, margin pressure from USD 18 billion annual content budgets forces operators to balance original production with catalog sharing pacts, accelerating a sector-wide shift toward revenue-per-user optimization.
Global Media Streaming Market Trends and Insights
Proliferation of Low-Cost 5G Data Plans Across Asia-Pacific
Deployment of affordable 5G networks has reshaped consumption patterns by supporting uninterrupted HD and 4K streams on mobile connections. Operators subsidize data packages because elevated video traffic monetizes premium network investments, creating a feedback loop that spurs both infrastructure build-out and content engagement. Edge nodes positioned close to viewers further trim latency, enabling personalized recommendations to refresh in real time. The result is sustained growth for the media streaming market in price-sensitive emerging economies.
SVOD Platform Expansion into Tier-II/III Cities in North America and Europe
Having saturated major metropolitan areas, leading services are targeting secondary cities where fiber rollout and improved rural broadband have lowered delivery cost. Localized production budgets are modest relative to global tent-pole titles, yet culturally tailored series drive higher loyalty among underserved audiences. Sophisticated recommendation algorithms that account for regional dialects and viewing times maintain engagement without raising content outlays, adding incremental revenue to the media streaming market.
Escalating Content-Licensing Costs Compressing Margins
Netflix's USD 18 billion outlay in 2025 underscores an inflationary spiral that squeezes profitability even for scale leaders. Fierce bidding for premium libraries diminishes differentiation because rival services can only pass a portion of costs to subscribers. Sharing agreements reduce immediate cash burn but blunt exclusivity advantages that underpin subscriber acquisition, challenging overall economics of the media streaming market.
Other drivers and restraints analyzed in the detailed report include:
- Exclusive Sports-Rights Wars Driving Premium Pricing
- Integration of Cloud-Native CDN and Edge Compute for Ultra-Low-Latency Live Streams
- Heightened Regulatory Scrutiny on Data Privacy and Localization
For complete list of drivers and restraints, kindly check the Table Of Contents.
Segment Analysis
Video maintained a commanding 77.35% revenue slice in 2025, reflecting entrenched viewing habits and heavy investment in exclusive series that anchor user retention. Music services, however, are expanding at an 8.82% CAGR aided by compact file sizes that stream reliably on constrained networks. The media streaming market size for audio is swelling as AI-driven playlists raise daily listening frequency and enlarge ad inventory.
Lower production costs and borderless appeal allow music platforms to monetize global audiences rapidly, while video players shoulder rising budgets for long-form content. This cost asymmetry encourages cross-format bundling, signalling a future where audio and video propositions converge within a single app to protect market share.
On-demand libraries accounted for 86.76% of 2025 revenue, yet live streaming's 9.44% CAGR illustrates growing appetite for real-time experiences. Sporting fixtures and tent-pole reality shows create appointment viewing that advertisers value, lifting revenue per stream above on-demand averages.
Technical complexity strengthens competitive moats: edge compute and custom protocols manage traffic spikes, ensuring latency below the two-second psychological threshold. Platforms mastering these capabilities are positioned to capture incremental media streaming market share during peak global events.
The Media Streaming Market Report is Segmented by Content Type (Video Streaming, Music Streaming), Service Type (Live Streaming, On-Demand Streaming), Revenue Model (Subscription, Advertising), Streaming Quality (SD, HD, 4K/UHD, 8K), and Geography. The Market Forecasts are Provided in Terms of Value (USD).
Geography Analysis
North America generated 34.48% of 2025 revenue but is maturing, prompting operators to pivot from user acquisition toward higher lifetime value. Bundling with fiber and mobile contracts, as demonstrated by Verizon's convergence strategy, locks in households and widens ARPU without heavy marketing spend. Sports-rights competition inflates programming costs, yet the presence of established ad markets sustains hybrid-tier profitability.
Asia-Pacific is projected to expand at a 8.97% CAGR, buoyed by governmental encouragement of local content creation and accelerating 5G coverage. Netflix recorded a 20% regional viewing surge after debuting culturally tailored originals, confirming that local narratives unlock outsized engagement. Governments are offering creator funds-India's USD 1 billion initiative is emblematic-that feed fresh catalogs and stimulate the media streaming market. Nonetheless, diverse data-localization rules compel parallel infrastructure builds, raising entry barriers for smaller brands. Europe shows uneven growth as GDPR compliance and fragmented language markets inflate operational overheads. Carriage agreements such as Netflix's tie-up with TF1 illustrate a hybrid model where streaming and traditional broadcasters collaborate to satisfy regulators and audiences. Latin America's fiber penetration-77.2% in Brazil and 70.9% in Chile-has started translating into higher-resolution streaming uptake, creating fresh addressable revenue. Africa remains mobile-first; low-bandwidth optimizations and downloadable content options are crucial to unlock latent demand.
- Netflix Inc.
- Spotify Technology S.A.
- Apple Inc. (Apple TV+, Apple Music)
- Amazon.com Inc. (Prime Video, Amazon Music)
- Alphabet Inc. (YouTube, YouTube Music)
- Tencent Holdings Ltd. (Tencent Video, QQ Music)
- The Walt Disney Company (Disney+, ESPN+)
- AT&T Inc. (Max / HBO, DirecTV Stream)
- Comcast Corp. (Peacock, NOW TV)
- Roku Inc.
- Deezer S.A.
- Baidu Inc. (iQIYI, Qian Qian Music)
- British Broadcasting Corporation (BBC iPlayer)
- Hulu LLC
- Pandora Media LLC
- ViacomCBS Inc. (Paramount+)
- Sony Group Corp. (Crunchyroll, Sony LIV)
- Naspers Ltd. (Showmax)
- FuboTV Inc.
- DAZN Group Ltd.
Additional Benefits:
- The market estimate (ME) sheet in Excel format
- 3 months of analyst support
TABLE OF CONTENTS
1 INTRODUCTION
- 1.1 Study Assumptions and Market Definition
- 1.2 Scope of the Study
2 RESEARCH METHODOLOGY
3 EXECUTIVE SUMMARY
4 MARKET LANDSCAPE
- 4.1 Market Overview
- 4.2 Market Drivers
- 4.2.1 Proliferation of Low-Cost 5G Data Plans Across Asia-Pacific
- 4.2.2 SVOD Platform Expansion into Tier-II/III Cities in North America and Europe
- 4.2.3 Exclusive Sports-Rights Wars Driving Premium Pricing
- 4.2.4 Integration of Cloud-Native CDN andEdge Compute for Ultra-Low-Latency Live Streams
- 4.2.5 Rise of FAST (Free Ad-Supported TV) Channels Boosting Ad Inventory
- 4.2.6 Bundling of Telco andMedia Services Inducing Subscriber Stickiness
- 4.3 Market Restraints
- 4.3.1 Escalating Content-Licensing Costs Compressing Margins
- 4.3.2 Fragmented Rights Management Hindering Global Release Windows
- 4.3.3 Persistent Last-Mile Latency in Emerging Economies
- 4.3.4 Heightened Regulatory Scrutiny on Data Privacy andLocalization
- 4.4 Regulatory Outlook
- 4.5 Porters Five Forces Analysis
- 4.5.1 Bargaining Power of Suppliers
- 4.5.2 Bargaining Power of Buyers
- 4.5.3 Threat of New Entrants
- 4.5.4 Threat of Substitutes
- 4.5.5 Intensity of Competitive Rivalry
5 MARKET SIZE AND GROWTH FORECASTS (VALUE)
- 5.1 By Content Type
- 5.1.1 Video Streaming
- 5.1.2 Music Streaming
- 5.2 By Service Type
- 5.2.1 Live Streaming
- 5.2.2 On-Demand Streaming
- 5.3 By Revenue Model
- 5.3.1 Subscription (SVOD/AVOD/Hybrid)
- 5.3.2 Advertising (AVOD/FAST)
- 5.4 By Streaming Quality
- 5.4.1 SD
- 5.4.2 HD
- 5.4.3 4K / UHD
- 5.4.4 8K
- 5.5 By Geography
- 5.5.1 North America
- 5.5.1.1 United States
- 5.5.1.2 Canada
- 5.5.1.3 Mexico
- 5.5.2 South America
- 5.5.2.1 Brazil
- 5.5.2.2 Argentina
- 5.5.2.3 Mexico
- 5.5.2.4 Rest of South America
- 5.5.3 Europe
- 5.5.3.1 Germany
- 5.5.3.2 United Kingdom
- 5.5.3.3 France
- 5.5.3.4 Italy
- 5.5.3.5 Spain
- 5.5.3.6 Rest of Europe
- 5.5.4 Asia-Pacific
- 5.5.4.1 China
- 5.5.4.2 Japan
- 5.5.4.3 South Korea
- 5.5.4.4 India
- 5.5.4.5 Australia
- 5.5.4.6 New Zealand
- 5.5.4.7 Rest of Asia-Pacific
- 5.5.5 Middle East
- 5.5.5.1 United Arab Emirates
- 5.5.5.2 Saudi Arabia
- 5.5.5.3 Rest of Middle East and Africa
- 5.5.6 Africa
- 5.5.6.1 South Africa
- 5.5.6.2 Rest of Africa
- 5.5.1 North America
6 COMPETITIVE LANDSCAPE
- 6.1 Strategic Developments
- 6.2 Vendor Positioning Analysis
- 6.3 Company Profiles (includes Global level Overview, Market level overview, Core Segments, Financials as available, Strategic Information, Products andServices, and Recent Developments)
- 6.3.1 Netflix Inc.
- 6.3.2 Spotify Technology S.A.
- 6.3.3 Apple Inc. (Apple TV+, Apple Music)
- 6.3.4 Amazon.com Inc. (Prime Video, Amazon Music)
- 6.3.5 Alphabet Inc. (YouTube, YouTube Music)
- 6.3.6 Tencent Holdings Ltd. (Tencent Video, QQ Music)
- 6.3.7 The Walt Disney Company (Disney+, ESPN+)
- 6.3.8 AT&T Inc. (Max / HBO, DirecTV Stream)
- 6.3.9 Comcast Corp. (Peacock, NOW TV)
- 6.3.10 Roku Inc.
- 6.3.11 Deezer S.A.
- 6.3.12 Baidu Inc. (iQIYI, Qian Qian Music)
- 6.3.13 British Broadcasting Corporation (BBC iPlayer)
- 6.3.14 Hulu LLC
- 6.3.15 Pandora Media LLC
- 6.3.16 ViacomCBS Inc. (Paramount+)
- 6.3.17 Sony Group Corp. (Crunchyroll, Sony LIV)
- 6.3.18 Naspers Ltd. (Showmax)
- 6.3.19 FuboTV Inc.
- 6.3.20 DAZN Group Ltd.
7 MARKET OPPORTUNITIES AND FUTURE OUTLOOK
- 7.1 White-space and Unmet-Need Assessment

