
PUBLISHER: Mordor Intelligence | PRODUCT CODE: 1910920

PUBLISHER: Mordor Intelligence | PRODUCT CODE: 1910920
Insurance Analytics - Market Share Analysis, Industry Trends & Statistics, Growth Forecasts (2026 - 2031)
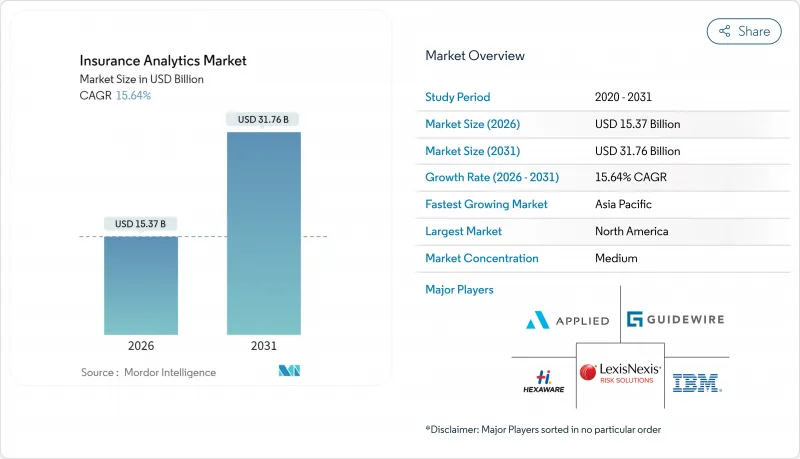
The insurance analytics market is expected to grow from USD 13.29 billion in 2025 to USD 15.37 billion in 2026 and is forecast to reach USD 31.76 billion by 2031 at 15.64% CAGR over 2026-2031.
Market expansion is underpinned by mounting regulatory demands for real-time solvency reporting, rapid data-stream proliferation from IoT devices, and insurers' need to streamline underwriting and claims workflows. Heightened climate-risk quantification requirements, rising embedded-insurance partnerships, and the democratization of cloud tools have widened adoption across organization sizes. Incumbent technology vendors are defending share by embedding generative AI directly into core systems, while insurtech entrants scale niche analytics that target fraud, parametric cover, and wellness-based life underwriting. Persistent data-privacy obligations and a tightening actuarial-data-science talent pool temper growth, yet the insurance analytics market continues to benefit from regulators clarifying AI governance frameworks, especially in North America and the European Union.
Global Insurance Analytics Market Trends and Insights
Increased Adoption of Advanced Technologies
Insurers accelerated AI deployment in 2024, with 88% of auto, 70% of home, and 58% of life carriers moving toward AI-enabled operations. Vendors such as IBM embedded generative models into underwriting and claims workflows, enabling automated damage assessment and next-best-offer recommendations . Cloud-first platforms now package computer-vision, graph, and large-language-model capabilities that handle unstructured image, text, and sensor streams, converting them into real-time risk scores. Regulatory bodies from the NAIC to EIOPA signaled acceptance of AI usage when firms document fairness, transparency, and board oversight. Consequently, enterprise spending on AI-ready infrastructure rose sharply, further fueling the insurance analytics market.
Rise in Competition Among Insurers
Digital-only challengers armed with AI pricing engines continue to pressure incumbent margins, forcing traditional carriers to shorten product cycles and personalize coverage. Venture capital funding shifted toward full-stack insurtechs that leverage real-time data ingestion to launch micro-duration or peer-to-peer products. Incumbents responded through acquisitions and strategic partnerships that fast-track modernization while securing cross-channel data visibility. Competitive intensity has reoriented C-suite priorities from channel expansion to analytical differentiation, accelerating demand for modular risk-scoring APIs and cloud-native data fabrics.
Stringent Data-Privacy and Governance Regulations
The EU AI Act and GDPR classify many insurance analytics functions as high risk, mandating explainability assessments, dataset documentation, and post-deployment monitoring. Similar rulemaking in U.S. states obliges carriers to file model-risk-management attestations, extending project timelines and compliance budgets. Multinational carriers must harmonize controls across jurisdictions, driving up the total cost of ownership for analytics platforms that cannot automate lineage logging or bias detection. These compliance burdens slow deployment, particularly for smaller firms, and subtract 2.1 percentage points from forecast CAGR.
Other drivers and restraints analyzed in the detailed report include:
- Growing Volume of Internal and External Data Streams
- Climate-Risk Quantification Demands
- High Concern Over Cybersecurity and Data Breaches
For complete list of drivers and restraints, kindly check the Table Of Contents.
Segment Analysis
Tools contributed USD 9.01 billion to the insurance analytics market size in 2025, equating to 67.79% share and reflecting carriers' preference for retaining strategic control of data assets. Services, although smaller, are scaling at 14.6% CAGR as insurers seek expert guidance for AI-governance frameworks and multi-cloud optimization. Vendors integrate low-code model-management dashboards and pre-built risk libraries, but carriers still rely on systems integrators to retrofit these capabilities into legacy cores. The push toward outcome-based pricing, where consultancy fees hinge on loss-ratio improvements, further underpins services growth.
Enterprises with heterogeneous policy-administration stacks often choose services to avoid costly platform rewrites, engaging providers for data-strategy workshops, model-validation exercises, and regulatory-filing automation. Meanwhile, SMEs favor packaged analytics suites that offer embedded guidance, illustrating how services and tools complement rather than cannibalize each other in the insurance analytics market.
Claims management held a 34.12% insurance analytics market share in 2025, anchored by straight-through-processing engines that boost adjuster productivity and customer satisfaction metrics. Yet fraud detection solutions are projected to scale at a 18.95% CAGR, as carriers deploy anomaly-detection networks that flag suspicious claims within seconds, helping to cut loss costs by double-digit percentages. Integrated image-forensics and behavioral-analytics modules further compress investigation cycles, driving ROI narratives that appeal to finance chiefs.
Growth momentum also arises from API-first fraud platforms that connect seamlessly with third-party data brokers, enriching risk signals without extensive in-house engineering. Over the forecast period, machine-learning-based fraud utilities will migrate from pilot projects to enterprise standards, reshaping the insurance analytics market as regulatory bodies mandate anti-fraud controls.
Insurance Analytics Market Report Segments the Industry Into by Component (Tools and Services), Business Application (Claims Management, Risk Management, and More), Deployment Mode (On-Premise, Cloud), End-User (Insurance Companies, and More), Insurance Line (Life and Health, Property and Casualty, and More), Organization Size (Large Enterprises, and SMEs), and Geography. The Market Forecasts are Provided in Terms of Value (USD).
Geography Analysis
North America led the insurance analytics market with 38.02% revenue share in 2025, buoyed by robust cloud adoption, deep capital markets, and the NAIC's AI Model Bulletin, which provides regulatory clarity and accelerates tech-investment decisions. U.S. carriers benefit from mature insurtech funding pipelines and ready access to specialized data vendors, while Canadian firms leverage cross-border technology partnerships to extend analytic capabilities without proportional head-count increases.
Asia-Pacific is projected to post a 16.25% CAGR through 2031, driven by accelerating digital-insurance penetration in China, India, and Southeast Asia. Regional incumbents collaborate with hyper-scalers to launch pay-as-you-drive auto cover and micro-duration travel policies, both reliant on real-time data ingestion. Governments in Singapore and South Korea provide regulatory sandboxes that stimulate product experimentation, thereby fostering a fertile environment for insurance analytics market expansion.
Europe maintains balanced growth despite stringent GDPR and EU AI Act compliance requirements. Carriers in Germany, France, and the United Kingdom invest heavily in explainable-AI tooling to satisfy regulators while unlocking underwriting insights. Nordic insurers act as analytics bellwethers, piloting climate-scenario generators and embedded-insurance orchestration layers that could shape wider continental adoption.
- IBM Corporation
- Oracle Corporation
- SAP SE
- SAS Institute Inc.
- Microsoft Corporation
- Guidewire Software Inc.
- LexisNexis Risk Solutions (RELX plc)
- Hexaware Technologies Ltd.
- Applied Systems Inc.
- Sapiens International Corporation N.V.
- OpenText Corporation
- MicroStrategy Incorporated
- Verisk Analytics, Inc.
- Salesforce, Inc. (Tableau)
- Accenture plc
- Cognizant Technology Solutions Corp.
- BAE Systems plc
- Palantir Technologies Inc.
- Fair Isaac Corporation (FICO)
- DataRobot, Inc.
- Optum, Inc. (UnitedHealth Group)
Additional Benefits:
- The market estimate (ME) sheet in Excel format
- 3 months of analyst support
TABLE OF CONTENTS
1 INTRODUCTION
- 1.1 Study Assumptions and Market Definition
- 1.2 Scope of the Study
2 RESEARCH METHODOLOGY
3 EXECUTIVE SUMMARY
4 MARKET INSIGHTS
- 4.1 Market Overview
- 4.2 Market Drivers
- 4.2.1 Increased adoption of advanced technologies
- 4.2.2 Rise in competition among insurers
- 4.2.3 Growing volume of internal and external data streams
- 4.2.4 Climate-risk quantification demands
- 4.2.5 Embedded-insurance ecosystem expansion
- 4.2.6 Regulatory push toward real-time solvency reporting
- 4.3 Market Restraints
- 4.3.1 Stringent data-privacy and governance regulations
- 4.3.2 High concern over cybersecurity and data breaches
- 4.3.3 Actuarial-data-science talent gap
- 4.3.4 Vendor lock-in and data-portability limitations
- 4.4 Value Chain Analysis
- 4.5 Regulatory Landscape
- 4.6 Technological Outlook
- 4.7 Porter's Five Forces
- 4.7.1 Bargaining Power of Suppliers
- 4.7.2 Bargaining Power of Buyers
- 4.7.3 Threat of New Entrants
- 4.7.4 Threat of Substitutes
- 4.7.5 Competitive Rivalry
- 4.8 Industry Ecosystem Analysis
- 4.9 Key Use Cases and Case Studies
- 4.10 Assessment of Macroeconomic Trends
- 4.11 Investment Analysis
5 MARKET SEGMENTATION
- 5.1 By Component
- 5.1.1 Tools
- 5.1.2 Services
- 5.2 By Business Application
- 5.2.1 Claims Management
- 5.2.2 Risk Management
- 5.2.3 Fraud Detection and Prevention
- 5.2.4 Process Optimization
- 5.2.5 Customer Management and Personalization
- 5.3 By Deployment Mode
- 5.3.1 On-Premise
- 5.3.2 Cloud
- 5.4 By End-User
- 5.4.1 Insurance Companies
- 5.4.2 Government Agencies
- 5.4.3 Third-Party Administrators, Brokers and Consultancies
- 5.5 By Insurance Line
- 5.5.1 Life and Health
- 5.5.2 Property and Casualty
- 5.5.3 Auto
- 5.5.4 Specialty Lines
- 5.6 By Organization Size
- 5.6.1 Large Enterprises
- 5.6.2 Small and Medium Enterprises (SMEs)
- 5.7 By Geography
- 5.7.1 North America
- 5.7.1.1 United States
- 5.7.1.2 Canada
- 5.7.1.3 Mexico
- 5.7.2 South America
- 5.7.2.1 Brazil
- 5.7.2.2 Argentina
- 5.7.2.3 Colombia
- 5.7.2.4 Rest of South America
- 5.7.3 Europe
- 5.7.3.1 Germany
- 5.7.3.2 United Kingdom
- 5.7.3.3 France
- 5.7.3.4 Italy
- 5.7.3.5 Spain
- 5.7.3.6 Russia
- 5.7.3.7 Netherlands
- 5.7.3.8 Rest of Europe
- 5.7.4 Asia-Pacific
- 5.7.4.1 China
- 5.7.4.2 Japan
- 5.7.4.3 South Korea
- 5.7.4.4 India
- 5.7.4.5 Australia
- 5.7.4.6 Singapore
- 5.7.4.7 Rest of Asia-Pacific
- 5.7.5 Middle East and Africa
- 5.7.5.1 Middle East
- 5.7.5.1.1 Saudi Arabia
- 5.7.5.1.2 United Arab Emirates
- 5.7.5.1.3 Rest of Middle East
- 5.7.5.2 Africa
- 5.7.5.2.1 South Africa
- 5.7.5.2.2 Egypt
- 5.7.5.2.3 Rest of Africa
- 5.7.5.1 Middle East
- 5.7.1 North America
6 COMPETITIVE LANDSCAPE
- 6.1 Market Concentration
- 6.2 Strategic Moves
- 6.3 Market Share Analysis
- 6.4 Company Profiles (includes Global level Overview, Market level overview, Core Segments, Financials as available, Strategic Information, Market Rank/Share for key companies, Products and Services, and Recent Developments)
- 6.4.1 IBM Corporation
- 6.4.2 Oracle Corporation
- 6.4.3 SAP SE
- 6.4.4 SAS Institute Inc.
- 6.4.5 Microsoft Corporation
- 6.4.6 Guidewire Software Inc.
- 6.4.7 LexisNexis Risk Solutions (RELX plc)
- 6.4.8 Hexaware Technologies Ltd.
- 6.4.9 Applied Systems Inc.
- 6.4.10 Sapiens International Corporation N.V.
- 6.4.11 OpenText Corporation
- 6.4.12 MicroStrategy Incorporated
- 6.4.13 Verisk Analytics, Inc.
- 6.4.14 Salesforce, Inc. (Tableau)
- 6.4.15 Accenture plc
- 6.4.16 Cognizant Technology Solutions Corp.
- 6.4.17 BAE Systems plc
- 6.4.18 Palantir Technologies Inc.
- 6.4.19 Fair Isaac Corporation (FICO)
- 6.4.20 DataRobot, Inc.
- 6.4.21 Optum, Inc. (UnitedHealth Group)
7 MARKET OPPORTUNITIES AND FUTURE OUTLOOK
- 7.1 White-space and Unmet-Need Assessment

