
PUBLISHER: Mordor Intelligence | PRODUCT CODE: 1911331

PUBLISHER: Mordor Intelligence | PRODUCT CODE: 1911331
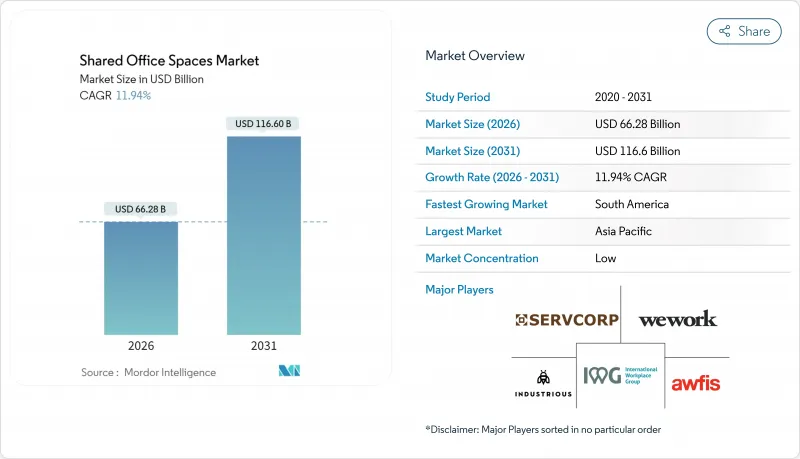
Shared Office Spaces - Market Share Analysis, Industry Trends & Statistics, Growth Forecasts (2026 - 2031)
The shared office spaces market is expected to grow from USD 59.20 billion in 2025 to USD 66.28 billion in 2026 and is forecast to reach USD 116.6 billion by 2031 at 11.94% CAGR over 2026-2031.
Rapid enterprise adoption of hybrid work, investor appetite for asset-light models, and steady expansion into secondary cities fuel this momentum. Operators are pivoting toward revenue-sharing partnerships that limit lease liabilities while extending network reach. Technology investments in wellness-certified, data-driven spaces deepen client stickiness, even as oversupply in legacy urban cores pressures margins. Asia-Pacific drives headline growth, while South America offers the steepest runway for new entrants courting first-time flexible-workspace users.
Global Shared Office Spaces Market Trends and Insights
Rapid Adoption of Hybrid and Flexible Work Models Across Corporations and SMEs
Hybrid and flexible work models are becoming increasingly prevalent among corporations and SMEs. Over 92% of clients surveyed by CBRE have adopted hybrid work schedules, with two-thirds anticipating their staff will be onsite a minimum of three days each week. This transition has turned extended leases into potential liabilities, making flexible terms a strategic imperative. Companies are gravitating towards shared office spaces, allowing them to adjust seating based on fluctuating attendance and reducing costs associated with unused space. This setup not only cuts costs but also attracts talent, as employees increasingly value location flexibility. Operators who can ensure top-tier security and consistent quality across different cities are witnessing a surge in demand.
Expansion of Global Co-working Operators into Emerging and Secondary Cities
Global co-working operators are increasingly expanding into emerging and secondary cities to meet growing demand. In 2024, IWG increased its revenue to GBP3.3 billion (USD 4.1 billion) by opening 867 sites, primarily through partnerships. By focusing on asset-light deals, the company allocates more capital to fit-outs rather than leases. This approach improves their Return on Invested Capital (ROIC) and supports their growth into suburbs and tier-II metros, areas previously lacking premium co-working spaces. With distributed locations, IWG reduces commute times for remote-first teams, shifting from a traditional downtown-focused model to a hub-and-spoke network. This strategy not only protects operators from potential vacancies in central business districts but also addresses the unmet needs of local SMEs.
High Operational and Fit-out Costs Reducing Operator Profitability
High operational and fit-out costs are significantly impacting the profitability of operators in the flexible workspace market. In Q2 2024, WeWork's occupancy dipped to 67%, raising concerns about its solvency as fixed costs eclipsed its billings. The company's premium interiors, enterprise-level IT, and top-tier services demand hefty capital expenditures. These costs weigh heavily, especially when seats remain unoccupied. While operators are increasingly partnering with landlords to alleviate these capital burdens, smaller providers face challenges in financing modern refurbishments. This struggle could hasten their exit from the market and fuel further consolidation.
Other drivers and restraints analyzed in the detailed report include:
- Rising Demand from Start-ups, Freelancers, and Digital Nomads
- Investor Interest in Shared Office Portfolios as a Resilient Asset Class
- Oversupply Risks in Mature Markets Leading to Price Pressures
For complete list of drivers and restraints, kindly check the Table Of Contents.
Segment Analysis
Co-working accounted for 59.12% of the shared office spaces market share in 2025. Its success stems from turnkey access, community programming, and cost efficiency for pilot teams or market entries. Enterprises favor dedicated suites within co-working hubs to balance privacy with collaboration opportunities. Serviced offices and executive suites maintain relevance among firms needing fully equipped private spaces on sealed terms.
Hybrid and virtual solutions form the fastest-growing cohort at a 12.75% CAGR as 2026-2031 unfolds. They blend cloud-based desk bookings, distributed memberships, and on-demand meeting credits, mirroring wider hybrid-work protocols. WeWork's alliance with Vast Coworking Group to onboard 75 suburban sites without signing leases demonstrates operator migration toward networked service delivery. These models let companies toggle physical presence as project pipelines ebb and flow, reinforcing the value proposition of the shared office spaces market.
The Shared Office Spaces Market Report is Segmented by Type (Co-Working Space, Serviced Offices/Executive Suites and Others), by Sector (Information Technology, Business Consulting & Professional Service, and More), by End Use (Freelancers, Enterprises and Start Ups and Others), and by Geography (North America, South America, Europe, Asia-Pacific and More). The Market Forecasts are Provided in Terms of Value (USD).
Geography Analysis
In 2025, the Asia-Pacific region contributed 37.10% of global revenue, driven by rapid urbanization and government-supported innovation hubs. Co-working spaces in India, led by companies like Smartworks and IndiQube, saw occupancy levels near full capacity, especially as they expanded into tier-II cities. In China, shared offices are part of the country's smart-city plans. Southeast Asia is benefiting from an increase in tourists and digital nomads. Operators in the region are organizing culturally relevant community events to strengthen their network expansion strategies.
North America, while ranking second in value, faces mixed conditions. Downtown areas are experiencing lower prices due to rising vacancies, prompting operators to improve amenities to maintain rates. Suburbs, however, are performing well; 45% of flexible workspaces in the U.S. are now located outside central business districts, meeting the demand for shorter commutes. Enterprise clients are increasingly using suburban spaces as satellite offices, leading to the growth of networks in previously residential areas.
South America is growing the fastest, with a 13.28% CAGR projected through 2031. Brazil is leading this growth, but secondary markets in Colombia and Chile are also seeing increased interest from multinationals entering Latin America for the first time. Although currency volatility poses a risk, landlords are partnering with operators through management agreements to reduce entry risks. In Europe, growth is steady but moderate. Mobility frameworks and compliance with cross-border GDPR support this growth, particularly in capitals with stable policies for remote work visas.
- IWG plc (Regus, Spaces)
- WeWork Inc.
- Industrious
- Servcorp Ltd.
- Awfis Space Solutions
- Smartworks
- Ucommune International
- JustCo
- Convene
- Knotel
- Impact Hub
- Office Evolution
- Serendipity Labs
- Expansive (-formerly Novel Coworking)
- CommonGrounds Workplace
- The Executive Centre
- Bizspace
- Workbar
- WorkSuites
- Office Partners 360
Additional Benefits:
- The market estimate (ME) sheet in Excel format
- 3 months of analyst support
TABLE OF CONTENTS
1 Introduction
- 1.1 Study Assumptions & Market Definition
- 1.2 Scope of the Study
2 Research Methodology
3 Executive Summary
4 Market Landscape
- 4.1 Market Overview
- 4.2 Market Drivers
- 4.2.1 Rapid adoption of hybrid and flexible work models across corporates and SMEs
- 4.2.2 Expansion of global co-working operators into emerging and secondary cities
- 4.2.3 Rising demand from start-ups, freelancers, and digital nomads
- 4.2.4 Investor interest in shared office portfolios as resilient asset class
- 4.2.5 Increasing tenant preference for wellness-certified, tech-enabled, and community-driven spaces
- 4.3 Market Restraints
- 4.3.1 High operational and fit-out costs reducing operator profitability
- 4.3.2 Oversupply risks in mature markets leading to price pressures
- 4.3.3 Economic volatility impacting occupancy stability for SMEs and start-ups
- 4.4 Value / Supply-Chain Analysis
- 4.4.1 Overview
- 4.4.2 Real Estate Developers and Asset Owners - Key Quantitative and Qualitative Insights
- 4.4.3 Workspace Design and Technology Consultants - Key Quantitative and Qualitative Insights
- 4.4.4 Modular Furniture and Smart Office Solutions Providers - Key Quantitative and Qualitative Insights
- 4.5 Government Regulations and Initiatives in the Industry
- 4.6 Technological Innovations in the Shared Office Space Real Estate Market
- 4.7 Insights into the Key Office Real Estate Industry Metrics (Supply, Rentals, Prices, Occupancy/Vacancy (%))
- 4.8 Impact of Remote Working on Space Demand
- 4.9 Porter's Five Forces
- 4.9.1 Bargaining Power of Suppliers
- 4.9.2 Bargaining Power of Buyers
- 4.9.3 Threat of New Entrants
- 4.9.4 Threat of Substitutes
- 4.9.5 Intensity of Competitive Rivalry
5 Market Size & Growth Forecasts (Value USD)
- 5.1 By Type
- 5.1.1 Co-Working Space
- 5.1.2 Serviced offices / Executive suites
- 5.1.3 Others (Hybrid, Virtual Office)
- 5.2 By Sector
- 5.2.1 Information Technology (IT and ITES)
- 5.2.2 BFSI (Banking, Financial Services and Insurance)
- 5.2.3 Business Consulting & Professional Service
- 5.2.4 Other Services (Retail, Lifesciences, Energy, Legal Services)
- 5.3 By End Use
- 5.3.1 Freelancers
- 5.3.2 Enterprises
- 5.3.3 Start Ups and Others
- 5.4 By Geography
- 5.4.1 North America
- 5.4.1.1 United States
- 5.4.1.2 Canada
- 5.4.1.3 Mexico
- 5.4.2 South America
- 5.4.2.1 Brazil
- 5.4.2.2 Rest of South America
- 5.4.3 Europe
- 5.4.3.1 United Kingdom
- 5.4.3.2 Germany
- 5.4.3.3 France
- 5.4.3.4 Italy
- 5.4.3.5 Spain
- 5.4.3.6 Rest of Europe
- 5.4.4 Middle East and Africa
- 5.4.4.1 Saudi Arabia
- 5.4.4.2 United Arab Emirates
- 5.4.4.3 Rest of Middle East and Africa
- 5.4.5 Asia-Pacific
- 5.4.5.1 China
- 5.4.5.2 India
- 5.4.5.3 Japan
- 5.4.5.4 South Korea
- 5.4.5.5 Australia
- 5.4.5.6 Indonesia
- 5.4.5.7 Rest of Asia-Pacific
- 5.4.1 North America
6 Competitive Landscape
- 6.1 Market Concentration
- 6.2 Strategic Moves
- 6.3 Company Profiles {(includes Global level Overview, Market level overview, Core Segments, Financials as available, Strategic Information, Products & Services, and Recent Developments)}
- 6.3.1 IWG plc (Regus, Spaces)
- 6.3.2 WeWork Inc.
- 6.3.3 Industrious
- 6.3.4 Servcorp Ltd.
- 6.3.5 Awfis Space Solutions
- 6.3.6 Smartworks
- 6.3.7 Ucommune International
- 6.3.8 JustCo
- 6.3.9 Convene
- 6.3.10 Knotel
- 6.3.11 Impact Hub
- 6.3.12 Office Evolution
- 6.3.13 Serendipity Labs
- 6.3.14 Expansive (-formerly Novel Coworking)
- 6.3.15 CommonGrounds Workplace
- 6.3.16 The Executive Centre
- 6.3.17 Bizspace
- 6.3.18 Workbar
- 6.3.19 WorkSuites
- 6.3.20 Office Partners 360
7 Market Opportunities & Future Outlook

