
PUBLISHER: Mordor Intelligence | PRODUCT CODE: 1911470

PUBLISHER: Mordor Intelligence | PRODUCT CODE: 1911470
North America Trash Bags - Market Share Analysis, Industry Trends & Statistics, Growth Forecasts (2026 - 2031)
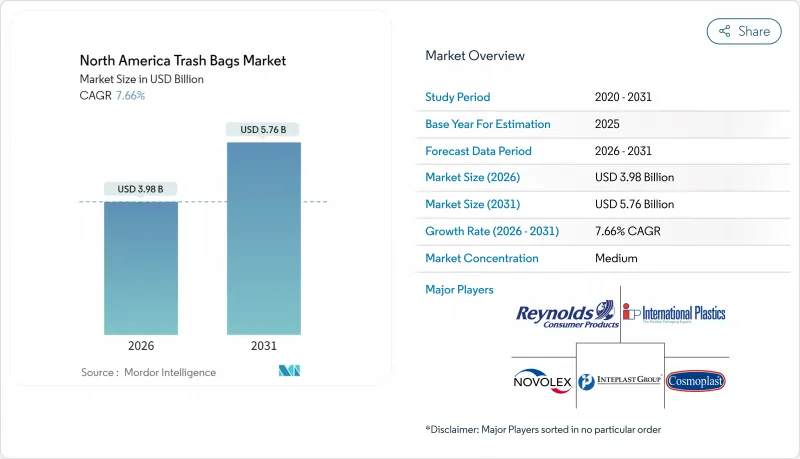
The North America trash bags market was valued at USD 3.70 billion in 2025 and estimated to grow from USD 3.98 billion in 2026 to reach USD 5.76 billion by 2031, at a CAGR of 7.66% during the forecast period (2026-2031).
Sustained growth in the municipal waste stream, regulatory incentives for landfill diversion, and corporate zero-waste mandates continue to drive demand across residential, commercial, and industrial channels. State pay-as-you-throw (PAYT) schemes, most notably in New England, continue to lift per-capita bag purchase. Biodegradable and recycled-content products are gaining shelf space as seven U.S. states roll out extended producer responsibility (EPR) laws that incentivize the adoption of post-consumer resin. At the same time, polyethylene price volatility has forced producers to diversify their feedstocks and secure supply through new mechanical recycling ventures, including the Nova-Novolex plant in Indiana. Brand owners are courting consumers with scent-infused SKUs, while B2B buyers prioritize contractor-grade liners that withstand heavy, cardboard-rich e-commerce refuse.
North America Trash Bags Market Trends and Insights
Residential Waste-Stream Expansion and State Landfill-Diversion Targets
Mandatory diversion policies are reshaping waste collection norms, prompting municipalities to specify certified compostable or recycled-content liners in public procurement. California's SB 1383 has already increased organic recycling tonnage by 14% in Sacramento, while landfill inputs fell by 10% during the same period. Canada's draft methane rule aims for a 50% reduction in landfill emissions by 2030, a goal that encourages public facilities to adopt ASTM D6400-compliant organics bags [CANADA.CA]. Such rules keep municipal bid volumes growing, particularly for 13-30 gallon liners that fit curbside carts
Corporate Zero-Waste Pledges from Fortune 500 Facilities
Enterprise-wide diversion targets are converting multi-site buyers into large, long-term accounts. Cox Enterprises has diverted 750 million lb from landfill and credited waste programs with USD 340 million in financial value. Target now processes organics at 1,680 U.S. locations and has already reached 85% operational diversion. These programs demand consistent SKU specifications, clear-film sortation bags, and industrial compostable liners that can handle food scraps and corrugated offcuts simultaneously.
Volatile Polyethylene and Bioplastic Feedstock Prices
Polyethylene spot values fell 11.95% year-on-year in 2025 after hurricane-linked outages on the Gulf Coast squeezed inventories before producers pushed a USD 0.05-0.07-per-lb contract hike. Buyers responded by trimming stock cover to 18 days, leaving converters exposed to price spikes. Similar volatility affects biopolymer markets, where fermenter output depends on corn and sugar feedstocks, which have their own price fluctuations. Margin uncertainty hinders capital investment in new extrusion lines and can delay the commercial launch of innovative SKUs.
Other drivers and restraints analyzed in the detailed report include:
- Rapid E-Commerce Packaging Turnover Elevating Commercial Trash Volume
- Municipal Pay-As-You-Throw Programs Accelerating Bag Consumption
- Single-Use-Plastic Bans and Extended-Producer-Responsibility Laws
For complete list of drivers and restraints, kindly check the Table Of Contents.
Segment Analysis
The residential channel still accounts for the largest slice of the North America trash bags market size, posting 45.65% share in 2025 as curbside collection and PAYT schemes keep kitchen liners moving through grocery aisles. Yet, industrial buyers, from automotive plants to data center campuses, are ramping up purchases at a 7.88% CAGR through 2031. Many are locked into zero-landfill targets that necessitate heavier-gauge liners rated for metal shavings, resin pellets, or bulky packaging. Supplier contracts often bundle color-coded segregation bags, anti-static drum liners, and 55-gallon builders' sacks, boosting average selling price relative to household SKUs.
Industrial volume gains reflect healthy construction spending and the onshoring of manufacturing. Large projects generate concentrated waste nodes, creating predictable, pallet-level orders that shave logistics costs for converters. The North America trash bags market share for industrial applications is therefore expected to approach the residential share by decade-end as new plants come online and legacy facilities retrofit waste-sorting zones to meet ESG metrics.
LDPE retained 41.05% revenue share in 2025 thanks to its balance of tear resistance and cost efficiency. However, legislative tailwinds are sending ASTM D6400-certified bags up the adoption curve, with the sub-category tracking a 7.74% CAGR. California's SB 1046 requires compostable pre-checkout bags with a minimum 15-inch mouth width, effective starting in 2025. Echo effects include supermarket chains sourcing matching compostable trash liners for back-of-house organics totes. At the same time, mechanical-recycling investments are improving the clarity of recycled LDPE pellets, helping traditional film retain customer loyalty where certified composting facilities remain scarce.
Overall, the North America trash bags market is shifting toward a dual-portfolio model, featuring mainstream LDPE or HDPE for general refuse and premium-priced biodegradable options for organics, as well as brand-led sustainability messaging. This bifurcation provides converters with the flexibility to hedge against feedstock swings while meeting regional compliance requirements.
The North America Trash Bags Market Report is Segmented by End User (Residential, Commercial, Industrial), Product Type (LDPE Bags, HDPE Bags and More), Capacity (< 8 Gal, 8-30 Gal, 30-55 Gal, > 55 Gal), Material Source (Virgin Plastic, Post-Consumer Recycled Plastic, Hybrid, Bio-Based Resins), Sales Channel (Offline Retail, and More), and Geography (United States, Canada). The Market Forecasts are Provided in Terms of Value (USD).
List of Companies Covered in this Report:
- Reynolds Consumer Products Inc. (Hefty)
- The Clorox Company (Glad Products Company)
- Novolex Holdings LLC
- Inteplast Group Corporation
- Riverside Paper Co. Inc.
- Cosmoplast Industrial Company LLC
- International Plastics Inc.
- Poly-America L.P.
- Four Star Plastics Inc.
- Neway Packaging Corporation
- All American Poly Corp.
- Aluf Plastics Inc.
- Petoskey Plastics Inc.
- Heritage Bag Company
- Crown Poly Inc.
- WasteZero Inc.
- Matrix Packaging LLC
- Elkay Plastics Co. Inc.
- Interplast Packaging LLC
- Super Bag Corp.
- RollPak Corp.
- Boulder Bag Company
Additional Benefits:
- The market estimate (ME) sheet in Excel format
- 3 months of analyst support
TABLE OF CONTENTS
1 INTRODUCTION
- 1.1 Study Assumptions and Market Definition
- 1.2 Scope of the Study
2 RESEARCH METHODOLOGY
3 EXECUTIVE SUMMARY
4 MARKET LANDSCAPE
- 4.1 Market Overview
- 4.2 Market Drivers
- 4.2.1 Residential waste-stream expansion and state landfill-diversion targets
- 4.2.2 Corporate zero-waste pledges from Fortune 500 facilities
- 4.2.3 Rapid e-commerce packaging turnover elevating commercial trash volume
- 4.2.4 Municipal pay-as-you-throw (PAYT) programs accelerating bag consumption
- 4.2.5 High-clarity, recycled-content resins enabling premium pricing (under-the-radar)
- 4.2.6 Adoption of anti-microbial liners in healthcare and foodservice (under-the-radar)
- 4.3 Market Restraints
- 4.3.1 Volatile polyethylene and bioplastic feedstock prices
- 4.3.2 Single-use-plastic bans and extended-producer-responsibility (EPR) laws
- 4.3.3 Retail SKU cannibalization from reusable tote initiatives
- 4.3.4 Logistics emissions scrutiny curbing import of low-grade liners
- 4.4 Value / Supply-Chain Analysis
- 4.5 Regulatory Landscape
- 4.6 Technological Outlook
- 4.7 Porter's Five Forces Analysis
- 4.7.1 Bargaining Power of Suppliers
- 4.7.2 Bargaining Power of Buyers
- 4.7.3 Threat of New Entrants
- 4.7.4 Threat of Substitutes
- 4.7.5 Intensity of Competitive Rivalry
- 4.8 Fragrance and additive formulation trends
5 MARKET SIZE AND GROWTH FORECASTS (VALUE)
- 5.1 By End User
- 5.1.1 Residential
- 5.1.2 Commercial
- 5.1.3 Industrial
- 5.2 By Product Type
- 5.2.1 Low-Density Polyethylene (LDPE) Bags
- 5.2.2 High-Density Polyethylene (HDPE) Bags
- 5.2.3 Biodegradable / Compostable Bags
- 5.3 By Capacity (Gallons)
- 5.3.1 < 8 Gal (Bathroom)
- 5.3.2 8 - 30 Gal (Kitchen)
- 5.3.3 30 - 55 Gal (Contractor)
- 5.3.4 > 55 Gal (Industrial Drum Liners)
- 5.4 By Material Source
- 5.4.1 Virgin Plastic
- 5.4.2 Post-Consumer Recycled Plastic
- 5.4.3 Hybrid (Recycled + Virgin)
- 5.4.4 Bio-based Resins
- 5.5 By Sales Channel
- 5.5.1 Offline Retail (Grocery, Mass Merchandiser)
- 5.5.2 Online Retail
- 5.5.3 Jan-San / Institutional Distribution
- 5.6 By Country
- 5.6.1 United States
- 5.6.2 Canada
6 COMPETITIVE LANDSCAPE
- 6.1 Market Concentration
- 6.2 Strategic Moves
- 6.3 Market Share Analysis
- 6.4 Company Profiles (includes Global level Overview, Market level overview, Core Segments, Financials as available, Strategic Information, Market Rank/Share for key companies, Products and Services, and Recent Developments)
- 6.4.1 Reynolds Consumer Products Inc. (Hefty)
- 6.4.2 The Clorox Company (Glad Products Company)
- 6.4.3 Novolex Holdings LLC
- 6.4.4 Inteplast Group Corporation
- 6.4.5 Riverside Paper Co. Inc.
- 6.4.6 Cosmoplast Industrial Company LLC
- 6.4.7 International Plastics Inc.
- 6.4.8 Poly-America L.P.
- 6.4.9 Four Star Plastics Inc.
- 6.4.10 Neway Packaging Corporation
- 6.4.11 All American Poly Corp.
- 6.4.12 Aluf Plastics Inc.
- 6.4.13 Petoskey Plastics Inc.
- 6.4.14 Heritage Bag Company
- 6.4.15 Crown Poly Inc.
- 6.4.16 WasteZero Inc.
- 6.4.17 Matrix Packaging LLC
- 6.4.18 Elkay Plastics Co. Inc.
- 6.4.19 Interplast Packaging LLC
- 6.4.20 Super Bag Corp.
- 6.4.21 RollPak Corp.
- 6.4.22 Boulder Bag Company
7 MARKET OPPORTUNITIES AND FUTURE OUTLOOK
- 7.1 White-space and Unmet-Need Assessment

