
PUBLISHER: Mordor Intelligence | PRODUCT CODE: 1911702

PUBLISHER: Mordor Intelligence | PRODUCT CODE: 1911702
Shrimp - Market Share Analysis, Industry Trends & Statistics, Growth Forecasts (2026 - 2031)
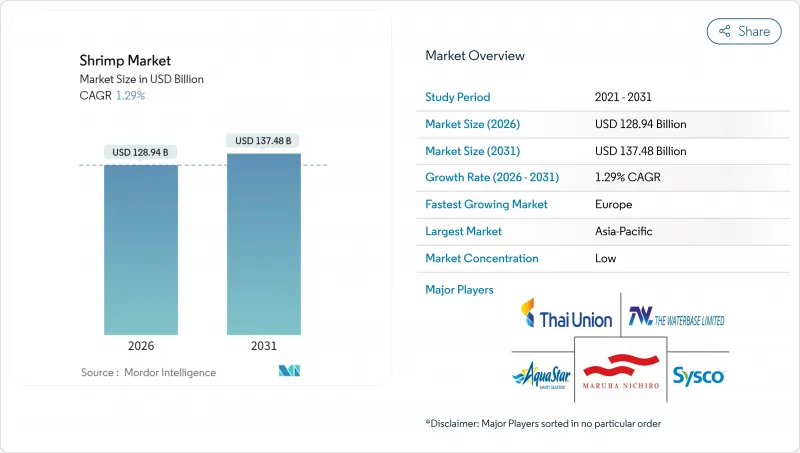
The shrimp market is expected to grow from USD 127.30 billion in 2025 to USD 128.94 billion in 2026 and is forecast to reach USD 137.48 billion by 2031 at 1.29% CAGR over 2026-2031.
Land-based recirculating aquaculture systems are gaining traction as climate change and disease outbreaks increasingly threaten the reliability of traditional open-pond farming. Vertically integrated companies are streamlining operations by controlling the entire value chain, including input supply, processing, and distribution. Sustainability-focused procurement policies, particularly in Europe, are influencing global trade patterns. By species, pink shrimp currently dominate the market, but tiger shrimp are emerging as a strong competitor due to innovation in farming practices. In terms of product form, frozen shrimp lead the market; however, canned shrimp are experiencing notable growth. Regarding the source, farmed shrimp production continues to expand, but wild-caught shrimp maintain a premium position due to their perceived quality. For distribution channels, on-trade sales have traditionally dominated, but off-trade channels are witnessing faster growth across the shrimp industry. The shrimp market remains highly fragmented, with production spread across numerous small-scale pond operators, cooperatives, and processors.
Global Shrimp Market Trends and Insights
Rising consumer demand for protein-rich foods
Consumers are increasingly focusing on protein consumption, which is driving the growth of the shrimp market. As people shift toward healthier and more balanced diets, shrimp has become a popular choice due to its high nutritional value and ease of preparation. According to the International Food Information Council (IFIC) Food and Health Survey 2024, 71% of Americans are actively seeking to increase their protein intake, highlighting a global trend toward protein-rich diets. This demand aligns with the Royal Society of Chemistry's recommendation of a daily protein intake of 45 grams for healthy women and 55 grams for healthy men. Shrimp is an excellent option to meet these requirements, as a 100-gram serving of cooked shrimp provides approximately 24 grams of protein, according to Medical News Today in 2024. Shrimp is affordable, quick to prepare, and versatile, making it a practical alternative to more expensive protein sources like beef and poultry. These factors are solidifying shrimp's position as a key component in global protein consumption trends.
Expansion of aquaculture capacity
Increasing aquaculture capacity is a major factor driving the market growth, supported by both government initiatives and private-sector investments. In India, the Pradhan Mantri Matsya Sampada Yojana (PMMSY) has allocated INR 2,398.72 crore for developing aquaculture infrastructure, including advanced pond systems and recirculatory systems in Andhra Pradesh from 2020 to 2025. This includes INR 559.10 crore in central government assistance. The state has provided INR 4,095.17 crore in power subsidies to over 68,000 aquaculture service connections and offers reduced electricity tariffs to support shrimp farmers, as per the Government of India. Similarly, Saudi Arabia's National Aquaculture Group (Naqua) is working to increase its shrimp production capacity to 250,000 tonnes annually by 2030, aligning with the country's Vision 2030 food security goals. Efforts to expand shrimp farming capacity, improve infrastructure, and reduce production costs are playing a crucial role in strengthening global supply chains.
Feed-price inflation and disease outbreaks at source farms
Increasing feed costs and frequent disease outbreaks are major challenges for the market, significantly affecting both profitability and production stability. Feed expenses make up nearly two-thirds of the total costs in shrimp farming, leaving the sector highly exposed to fluctuations in commodity prices. For example, in 2024, drought conditions in Brazil caused a sharp rise in soy prices, which led to a substantial increase in production costs across Asia. Farmers had to adjust feed formulations to manage these rising costs, but the impact was already felt. Diseases like early mortality syndrome (EMS) and white spot disease continue to severely affect shrimp farms, with reports from NOAA Fisheries indicating that some farms experienced up to 80% mortality rates during severe outbreaks. The growing resistance of these diseases to common treatments has forced farmers to invest more in preventive measures, such as improved aeration systems, water-exchange technologies, and disease management solutions.
Other drivers and restraints analyzed in the detailed report include:
- Growing demand for sustainable, certified, ethical, and traceable shrimp
- Increasing global seafood trade and export opportunities
- Climate change and water salinity issues
For complete list of drivers and restraints, kindly check the Table Of Contents.
Segment Analysis
Pink shrimp accounted for a significant 45.62% share of the market in 2025, primarily due to its widespread consumer appeal, efficient processing systems, and consistent availability throughout the year. Its popularity is attributed to its dependable quality, ease of preparation, and adaptability in various cuisines, making it a preferred choice for both households and restaurants. The availability of value-added products, such as peeled and deveined shrimp, has further boosted its demand. Pink shrimp benefits from well-established trade networks and economies of scale, solidifying its position as a key contributor to global shrimp consumption.
On the other hand, tiger shrimp is expected to grow at a faster pace, with a projected CAGR of 2.33% through 2031. This growth is driven by advancements in Specific Pathogen-Free (SPF) genetics, which have improved survival rates and enabled the production of larger shrimp sizes that fetch premium prices in gourmet and restaurant markets. Tiger shrimp is gaining traction in high-end foodservice and export markets, particularly in regions like North America, Europe, and parts of Asia. The combination of genetic advancements, specialized farming techniques, and increasing consumer demand for premium seafood positions tiger shrimp as a rapidly growing segment in the market.
Frozen shrimp continues to lead the global market, holding a 64.10% share in 2025. This dominance is largely due to advancements in Individually Quick Frozen (IQF) technology, which helps maintain the shrimp's texture, flavor, and freshness. Frozen shrimp is highly favored for its convenience, long shelf life, and consistent quality, making it a top choice for both consumers and retailers. The strong presence of cold-chain infrastructure supports its distribution to supermarkets, foodservice providers, and international markets. Ongoing investments in cold storage and logistics are helping frozen shrimp reach new regions, further driving its growth.
Canned shrimp is steadily gaining popularity and is expected to grow at a 3.62% CAGR through 2031. Its key advantage lies in its shelf-stable nature, making it suitable for areas with limited or unreliable refrigeration. Consumers are increasingly drawn to canned shrimp for its convenience and versatility, as it can be used in ready-to-eat meals, snacks, and various recipes. This format is particularly appealing in emerging markets, where it aligns with changing dietary habits and growing access to seafood products. As demand for easy-to-store and ready-to-use protein options rises, canned shrimp is carving out a significant niche in the shrimp industry.
The Shrimp Market Report is Segmented by Species (Pink Shrimp, Tiger Shrimp, and More), Form (Canned, Fresh/Chilled, and More), Source (Farmed and Wild-Caught), Distribution Channel (Off-Trade and On-Trade), and Geography (North America, Europe, Asia-Pacific, South America, and Middle East and Africa). The Market Forecasts are Provided in Terms of Value (USD) and Volume (Tons).
Geography Analysis
In 2025, Asia-Pacific accounted for 52.10% of the shrimp market revenue, driven by low labor costs, vast coastlines, and strong export infrastructure in countries like India, Vietnam, and Thailand. Government support, such as subsidies for aeration equipment and broodstock imports, has further strengthened the region's competitive edge. However, challenges like disease outbreaks and increasing labor costs are pushing some producers to adopt automated feeding systems and recirculating aquaculture systems (RAS) to maintain profitability. Rising domestic demand in countries like China and Indonesia allows producers to prioritize local markets over lower-margin exports, especially when international shipping costs increase.
Europe is the fastest-growing region, with a projected CAGR of 2.15% through 2031. This growth is largely driven by strict regulations promoting sustainable seafood, which has increased demand for certified products. For instance, Germany and the Netherlands are implementing retail programs that exclusively sell ASC-certified shrimp, enabling higher prices compared to non-certified imports. Meanwhile, land-based shrimp farming startups in the United Kingdom and Denmark are using renewable energy to promote local and sustainable production. Although these operations are still small, they highlight a potential shift in the market as sustainability becomes a key focus for foodservice chains aiming to reduce their carbon footprint within the shrimp industry.
North America remains a highly regulated import market where factors like strong cold-chain systems, portion-controlled packaging, and strict food safety standards determine supplier eligibility. Recent trade measures, such as antidumping duties on shrimp from India and Vietnam, have created opportunities for exporters from Ecuador and Honduras. These developments have encouraged the growth of inland RAS farms in United States states like Florida, Texas, and Massachusetts. In South America, Ecuador leads the market due to its deepwater ports and year-round shrimp production. In the Middle East and Africa, the shrimp market is still developing, supported by investments in food security and the expansion of temperature-controlled retail infrastructure, which helps overcome traditional supply chain limitations.
- Mazzetta Company, LLC
- Aqua Star Corp
- Trident Seafoods Corp.
- Sahlman Seafoods, Inc.
- The Waterbase Limited
- The Bumble Bee Seafood Company
- Thai Union (Chicken of the Sea)
- Avanti Feeds Limited
- Dulcich Inc.
- Premium Brands Holdings Corporation
- Ocean Garden Products Inc. (Central Seaway Company)
- Biloxi Freezing & Processing, Inc
- Apex Frozen Foods Ltd
- Maruha Nichiro Corp. (Umios Corp.)
- Sun Shrimp
- Beaver Street Fisheries
- Woods Fisheries
- Sysco Corporation
- Inland Shrimp Company
- High Liner Foods Inc.
Additional Benefits:
- The market estimate (ME) sheet in Excel format
- 3 months of analyst support
TABLE OF CONTENTS
1 INTRODUCTION
- 1.1 Study Assumptions and Market Definition
- 1.2 Scope of the Study
2 RESEARCH METHODOLOGY
3 EXECUTIVE SUMMARY
4 MARKET LANDSCAPE
- 4.1 Market Overview
- 4.2 Market Drivers
- 4.2.1 Rising consumer demand for protein-rich foods
- 4.2.2 Technology and farming innovation
- 4.2.3 Increasing global seafood trade and export opportunities
- 4.2.4 Growing consumer demand for shrimp that is sustainable, certified, ethical, and traceable sourced
- 4.2.5 Foodservice and ethnic cuisine demand
- 4.2.6 Expansion of aquaculture
- 4.3 Market Restraints
- 4.3.1 Labor and infrastructure challenges
- 4.3.2 Feed-price inflation and disease outbreaks at source farms
- 4.3.3 Stringent regulatory and quality standards
- 4.3.4 Climate change and water salinity issues
- 4.4 Regulatory Outlook
- 4.5 Consumer Behaviour Analysis
- 4.6 Porter's Five Forces
- 4.6.1 Threat of New Entrants
- 4.6.2 Bargaining Power of Buyers
- 4.6.3 Bargaining Power of Suppliers
- 4.6.4 Threat of Substitute Products
- 4.6.5 Intensity of Competitive Rivalry
5 MARKET SIZE AND GROWTH FORECASTS (VALUE AND VOLUME)
- 5.1 By Species
- 5.1.1 Pink Shrimp
- 5.1.2 Tiger Shrimp
- 5.1.3 Rock Shrimp
- 5.1.4 Others
- 5.2 By Form
- 5.2.1 Canned
- 5.2.2 Fresh/Chilled
- 5.2.3 Frozen
- 5.2.4 Dried
- 5.3 By Source
- 5.3.1 Farmed
- 5.3.2 Wild-Caught
- 5.4 By Distribution Channel
- 5.4.1 Off-Trade
- 5.4.1.1 Supermarkets/Hypermarkets
- 5.4.1.2 Online Retail Stores
- 5.4.1.3 Convenience Stores
- 5.4.1.4 Others
- 5.4.2 On-Trade
- 5.4.1 Off-Trade
- 5.5 By Geography
- 5.5.1 North America
- 5.5.1.1 United States
- 5.5.1.2 Canada
- 5.5.1.3 Mexico
- 5.5.1.4 Rest of North America
- 5.5.2 South America
- 5.5.2.1 Brazil
- 5.5.2.2 Colombia
- 5.5.2.3 Chile
- 5.5.2.4 Peru
- 5.5.2.5 Argentina
- 5.5.2.6 Rest of South America
- 5.5.3 Europe
- 5.5.3.1 United Kingdom
- 5.5.3.2 Germany
- 5.5.3.3 France
- 5.5.3.4 Italy
- 5.5.3.5 Spain
- 5.5.3.6 Poland
- 5.5.3.7 Belgium
- 5.5.3.8 Sweden
- 5.5.3.9 Rest of Europe
- 5.5.4 Asia-Pacific
- 5.5.4.1 China
- 5.5.4.2 Japan
- 5.5.4.3 India
- 5.5.4.4 Australia
- 5.5.4.5 Indonesia
- 5.5.4.6 South Korea
- 5.5.4.7 Thailand
- 5.5.4.8 Singapore
- 5.5.4.9 Rest of Asia-Pacific
- 5.5.5 Middle East and Africa
- 5.5.5.1 South Africa
- 5.5.5.2 Saudi Arabia
- 5.5.5.3 United Arab Emirates
- 5.5.5.4 Nigeria
- 5.5.5.5 Egypt
- 5.5.5.6 Morocco
- 5.5.5.7 Turkey
- 5.5.5.8 Rest of Middle East and Africa
- 5.5.1 North America
6 COMPETITIVE LANDSCAPE
- 6.1 Market Concentration
- 6.2 Strategic Moves
- 6.3 Market Share Analysis
- 6.4 Company Profiles (includes Global-level Overview, Market-level Overview, Core Segments, Financials (if available), Strategic Information, Market Rank/Share, Products and Services, Recent Developments)
- 6.4.1 Mazzetta Company, LLC
- 6.4.2 Aqua Star Corp
- 6.4.3 Trident Seafoods Corp.
- 6.4.4 Sahlman Seafoods, Inc.
- 6.4.5 The Waterbase Limited
- 6.4.6 The Bumble Bee Seafood Company
- 6.4.7 Thai Union (Chicken of the Sea)
- 6.4.8 Avanti Feeds Limited
- 6.4.9 Dulcich Inc.
- 6.4.10 Premium Brands Holdings Corporation
- 6.4.11 Ocean Garden Products Inc. (Central Seaway Company)
- 6.4.12 Biloxi Freezing & Processing, Inc
- 6.4.13 Apex Frozen Foods Ltd
- 6.4.14 Maruha Nichiro Corp. (Umios Corp.)
- 6.4.15 Sun Shrimp
- 6.4.16 Beaver Street Fisheries
- 6.4.17 Woods Fisheries
- 6.4.18 Sysco Corporation
- 6.4.19 Inland Shrimp Company
- 6.4.20 High Liner Foods Inc.
7 MARKET OPPORTUNITIES AND FUTURE OUTLOOK

