
PUBLISHER: Mordor Intelligence | PRODUCT CODE: 1911710

PUBLISHER: Mordor Intelligence | PRODUCT CODE: 1911710
Potash Fertilizer - Market Share Analysis, Industry Trends & Statistics, Growth Forecasts (2026 - 2031)
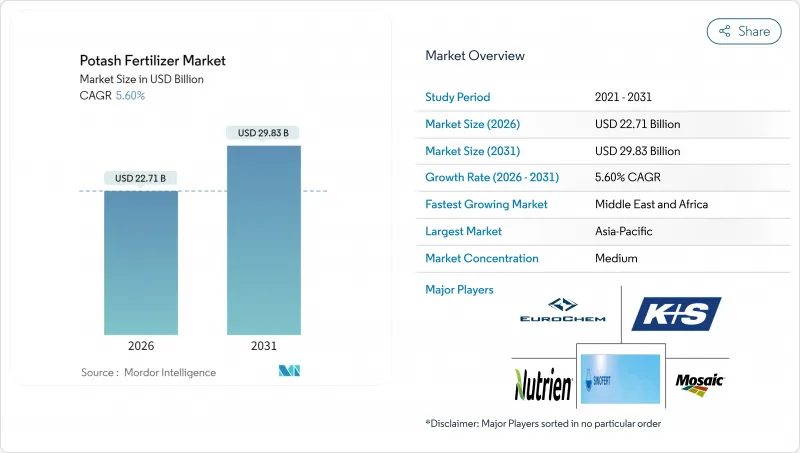
potash fertilizer market size in 2026 is estimated at USD 22.71 billion, growing from 2025 value of USD 21.51 billion with 2031 projections showing USD 29.83 billion, growing at 5.6% CAGR over 2026-2031.
Strong long-term demand arises from accelerating soil-nutrient depletion across intensively farmed regions, rapid adoption of precision-application tools, and policy-driven shifts in Chinese livestock feed formulations that boost domestic grain output. Producers are also benefiting from rising specialty crop acreage in Gulf states, an emerging industrial pull from green-hydrogen salt caverns, and corporate net-zero commitments that favor low-chloride sulfate of potash for sensitive soils. While logistics bottlenecks in Brazil and energy-price swings add cost pressure, leading suppliers are countering through capacity expansions, integrated distribution, and digital agronomy services that embed the product more deeply into farm decision cycles. Together, these forces point to continued momentum for the potash fertilizer market through 2030.
Global Potash Fertilizer Market Trends and Insights
Rising Soil-Nutrient Depletion in Intensively Farmed Regions
Decades of high-yield corn-soybean rotations and double-cropping systems have stripped potassium reserves faster than natural weathering can replace them, leaving many topsoils functionally deficient . In the U.S. Midwest, 60% of fields now test below agronomic sufficiency thresholds, a share that has risen every season since 2021 despite record fertilizer outlays. Similar erosion is unfolding in China's Yangtze grain belt, where intensive rice-wheat schedules compress fallow windows and prevent organic matter recovery. Newly cultivated Brazilian cerrado land appears fertile at first, yet within five growing cycles, it requires heavy potash doses as native minerals are oxidized and leached. These overlapping patterns create a structural consumption floor that insulates the potash fertilizer market from cyclical acreage swings. Agronomists warn that failing to close the nutrient gap could slice global cereal yields by 6-8% within a decade, reinforcing the urgency of sustained potassium application.
Accelerating Adoption of Precision-Application Technologies
Variable-rate spreaders, multispectral drones, and in-field potassium probes now let growers pinpoint micro-zones of deficiency that blanket applications once missed. John Deere data show farms above 2,000 acres raise total potash use by 15% after switching to zone-specific prescriptions because hidden low-K strips are finally corrected. Digital platforms also timestamp each pass, ensuring potassium is placed hours rather than days before peak plant uptake, which boosts grain weight and farmer revenue. Equipment makers bundle sensors and software into financing packages, lowering upfront barriers and speeding adoption in the Corn Belt and Canadian Prairies. Europe's Common Agricultural Policy adds fuel by reimbursing digital mapping costs, pushing precision adoption toward 40% of large holdings in Germany and France in 2025. As these tools migrate to medium-sized farms, the potash fertilizer market gains a durable volume lift that offsets incremental efficiency gains.
Geopolitical Sanctions Limiting Belaruskali Exports
European Union restrictions that took effect in March 2024 sidelined nearly 12 million tons of Belarusian potash capacity, equal to one fifth of global traded volume. Spot prices spiked 30% within weeks as traders scrambled for replacement cargoes, and ocean freight times to Southeast Asia lengthened by two months while supply chains realigned. Importers in India and China turned to Russian and Canadian miners, yet rail and port congestion capped replacement flows. Banks grew wary of letters of credit tied to Belarus, adding financing premiums that filter down to farm input costs. Though some sanctioned volumes may leak through third-country channels, uncertainty keeps users cautious about forward bookings. This constraint will persist at least through 2026, dampening potential upside for the potash fertilizer market.
Other drivers and restraints analyzed in the detailed report include:
- Shifting Chinese Feed Regulations Toward Grain-Based Livestock Rations
- Growing Specialty Crop Acreage for High-Value Gulf Horticulture
- Volatile Natural-Gas Prices Inflating Downstream Costs
For complete list of drivers and restraints, kindly check the Table Of Contents.
Segment Analysis
Muriate of Potash held 86.05% of the potash fertilizer market share in 2025, reflecting its role as the low-cost nutrient foundation for large grain systems. Its popularity stems from compatibility with common spreaders and rail networks that move bulk volumes quickly across farm belts. Cost per unit of potassium remains the deciding factor for corn, soybean, and wheat growers who manage thin operating margins. As a result, muriate continues to anchor procurement plans even when prices cycle upward.
Sulfate of Potash is expanding at a faster 5.85% CAGR as controlled-environment farms and chloride-sensitive crops gain ground. Growers of greenhouse tomatoes, table grapes, and potatoes value sulfate's low chloride profile, which supports product quality and export premiums. Europe leads adoption, with Germany and the Netherlands using it widely in heated glasshouses, while North America fruit and vegetable producers follow closely.
The Potash Fertilizer Market Report is Segmented by Product (Muriate of Potash, Sulfate of Potash, and Others), Application Mode (Fertigation, Foliar, and Soil), Crop Type (Field Crops, Horticultural Crops, and Turf and Ornamental), and Geography (North America, South America, Europe, Asia-Pacific, Middle East, and Africa). The Market Forecasts are Provided in Terms of Value and Volume.
Geography Analysis
The Asia-Pacific region captured 41.90% of the global potash fertilizer market share in 2025, representing the largest regional share. The region is projected to advance through 2031 at 5.5% CAGR, as diversified farming systems range from high-intensity grain belts to expanding perennial plantations. Policy incentives that subsidize precision inputs and balanced nutrition are increasing application rates, even as prices rise. Investments in controlled-environment agriculture add steady, year-round demand for low-chloride grades that complement broad-acre muriate volumes. Mining service firms in resource-rich economies are also pivoting into fertilizer distribution, improving supply security across remote production zones.
North America, the Middle East, and Africa are expected to experience the fastest expansion pace at a 6.82% CAGR between 2026 and 2031. In North America, widespread variable-rate technology is revealing hidden potassium deficits that push total nutrient use upward even as per-acre efficiency climbs. Concurrently, irrigation build-outs and food security programs across arid and semi-arid regions in the Middle East and Africa are unlocking previously marginal cropland. Specialty sulfate shipments into desert greenhouses complement bulk muriate flows into new row-crop estates, balancing the regional product mix.
Europe and South America demonstrate how mature acreage can still drive demand when nutrient stewardship and export competitiveness are aligned. Eastern European growers are rebuilding depleted soils and adopting zone sampling, while Western markets favor premium sulfate blends that mesh with organic labeling requirements. South America's potash fertilizer market is projected to grow at a significant CAGR, despite logistics bottlenecks and currency fluctuations. Ongoing rail and port upgrades, combined with the wider adoption of digital agronomy tools, are expected to alleviate supply constraints and sustain the region's growth momentum.
- Nutrien Ltd.
- The Mosaic Company
- Uralkali PJSC
- K+S Aktiengesellschaft
- Israel Chemicals Ltd.
- EuroChem Group AG
- JSC Belaruskali
- Arab Potash Company PLC
- Compass Minerals International Inc.
- Intrepid Potash Inc.
- Sinofert Holdings Ltd.
- Sociedad Quimica y Minera de Chile S.A.
- Yara International ASA
- BHP Group Limited
- Canpotex Limited
Additional Benefits:
- The market estimate (ME) sheet in Excel format
- 3 months of analyst support
TABLE OF CONTENTS
1 Introduction
- 1.1 Study Assumptions & Market Definition
- 1.2 Scope of the Study
- 1.3 Research Methodology
2 Report Offers
3 Executive Summary and Key Findings
4 Key Industry Trends
- 4.1 Acreage Of Major Crop Types
- 4.1.1 Field Crops
- 4.1.2 Horticultural Crops
- 4.2 Average Nutrient Application Rates
- 4.2.1 Primary Nutrients
- 4.2.1.1 Field Crops
- 4.2.1.2 Horticultural Crops
- 4.2.1 Primary Nutrients
- 4.3 Agricultural Land Equipped For Irrigation
- 4.4 Regulatory Framework
- 4.5 Value Chain & Distribution Channel Analysis
- 4.6 Market Drivers
- 4.6.1 Rising soil-nutrient depletion in intensively farmed regions
- 4.6.2 Accelerating adoption of precision-application technologies among large growers
- 4.6.3 Shifting Chinese feed regulations toward grain-based livestock rations
- 4.6.4 Growing specialty crop acreage for high-value horticulture in Gulf states (under-reported)
- 4.6.5 Potash demand from green-hydrogen salt caverns for seasonal storage (under-reported)
- 4.6.6 Corporate net-zero pledges driving sulfate-of-potash in low-chloride soils (under-reported)
- 4.7 Market Restraints
- 4.7.1 Geopolitical sanctions limiting Belaruskali exports
- 4.7.2 Volatile natural-gas prices inflating downstream fertilizer costs
- 4.7.3 Rising adoption of regenerative farming that lowers synthetic-input intensity
- 4.7.4 Infrastructure bottlenecks at Brazilian inland ports (under-reported)
5 Market Size and Growth Forecasts (Value and Volume)
- 5.1 Type
- 5.1.1 MoP
- 5.1.2 SoP
- 5.1.3 Others
- 5.2 Application Mode
- 5.2.1 Fertigation
- 5.2.2 Foliar
- 5.2.3 Soil
- 5.3 Crop Type
- 5.3.1 Field Crops
- 5.3.2 Horticultural Crops
- 5.3.3 Turf & Ornamental
- 5.4 Region
- 5.4.1 Asia-Pacific
- 5.4.1.1 Australia
- 5.4.1.2 Bangladesh
- 5.4.1.3 China
- 5.4.1.4 India
- 5.4.1.5 Indonesia
- 5.4.1.6 Japan
- 5.4.1.7 Pakistan
- 5.4.1.8 Philippines
- 5.4.1.9 Thailand
- 5.4.1.10 Vietnam
- 5.4.1.11 Rest of Asia-Pacific
- 5.4.2 Europe
- 5.4.2.1 France
- 5.4.2.2 Germany
- 5.4.2.3 Italy
- 5.4.2.4 Netherlands
- 5.4.2.5 Russia
- 5.4.2.6 Spain
- 5.4.2.7 Ukraine
- 5.4.2.8 United Kingdom
- 5.4.2.9 Rest of Europe
- 5.4.3 Middle East and Africa
- 5.4.3.1 Saudi Arabia
- 5.4.3.2 Turkey
- 5.4.3.3 South Africa
- 5.4.3.4 Nigeria
- 5.4.3.5 Rest of Middle East and Africa
- 5.4.4 North America
- 5.4.4.1 Canada
- 5.4.4.2 Mexico
- 5.4.4.3 United States
- 5.4.4.4 Rest of North America
- 5.4.5 South America
- 5.4.5.1 Argentina
- 5.4.5.2 Brazil
- 5.4.5.3 Rest of South America
- 5.4.1 Asia-Pacific
6 Competitive Landscape
- 6.1 Key Strategic Moves
- 6.2 Market Share Analysis
- 6.3 Company Landscape
- 6.4 Company Profiles (Includes Global level Overview, Market level Overview, Core Segments, Financials as Available, Strategic Information, Market Rank/Share for Key Companies, Products and Services, and Recent Developments)
- 6.4.1 Nutrien Ltd.
- 6.4.2 The Mosaic Company
- 6.4.3 Uralkali PJSC
- 6.4.4 K+S Aktiengesellschaft
- 6.4.5 Israel Chemicals Ltd.
- 6.4.6 EuroChem Group AG
- 6.4.7 JSC Belaruskali
- 6.4.8 Arab Potash Company PLC
- 6.4.9 Compass Minerals International Inc.
- 6.4.10 Intrepid Potash Inc.
- 6.4.11 Sinofert Holdings Ltd.
- 6.4.12 Sociedad Quimica y Minera de Chile S.A.
- 6.4.13 Yara International ASA
- 6.4.14 BHP Group Limited
- 6.4.15 Canpotex Limited
7 Key Strategic Questions For Fertilizer CEOS

