
PUBLISHER: Mordor Intelligence | PRODUCT CODE: 1911751

PUBLISHER: Mordor Intelligence | PRODUCT CODE: 1911751
Performing Art Companies - Market Share Analysis, Industry Trends & Statistics, Growth Forecasts (2026 - 2031)
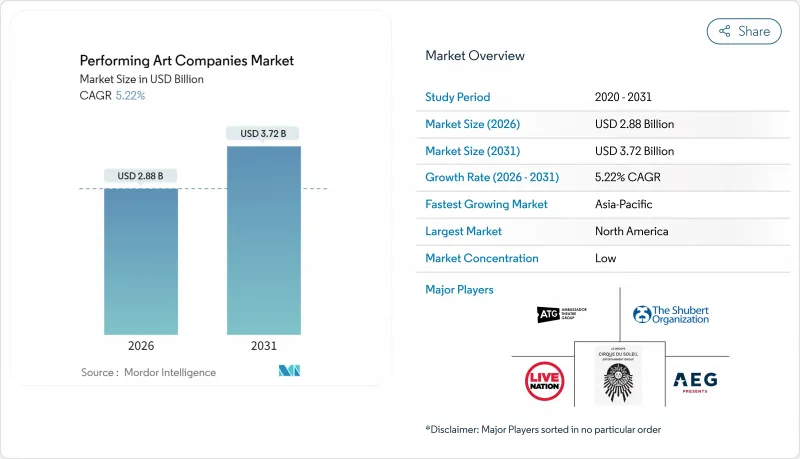
Performing Art Companies Market size in 2026 is estimated at USD 2.88 billion, growing from 2025 value of USD 2.74 billion with 2031 projections showing USD 3.72 billion, growing at 5.22% CAGR over 2026-2031.
The live events industry is witnessing a robust recovery, with ticket sales in North America, the United Kingdom, and Ireland rebounding to 93% of 2019 levels. This recovery highlights the strong consumer demand for in-person cultural experiences, emphasizing the sector's resilience and the continued prioritization of live entertainment by audiences . Corporate sponsorships, government tax incentives, and immersive technology adoption provide additional momentum, while selective consolidation and dynamic pricing strengthen venue economics. At the same time, climate-related disruptions, streaming substitution, and rising production costs present structural headwinds that temper the growth trajectory. The performing art companies market continues to reward players that reduce operating risk, leverage data-driven pricing, and cultivate differentiated audience experiences.
Global Performing Art Companies Market Trends and Insights
Post-pandemic rebound in live event attendance
Live entertainment has re-emerged as a cultural mainstay as consumers seek community experiences unavailable through digital platforms. Ticket sales in the United Kingdom and Ireland now surpass pre-COVID benchmarks, and North America is nearing full recovery. Festival footprints illustrate this resurgence; Edinburgh Festival sold 2.6 million tickets across 3,746 shows in 2024, signalling that large-scale programming can thrive despite cost pressures . Continued momentum depends on venues sustaining health protocols without diminishing the communal atmosphere that differentiates live performance. Operators that invest in customer-confidence measures and seamless on-site experiences are capturing disproportionate demand, reinforcing the performing arts companies' market as a resilient post-pandemic growth avenue.
Rise of digital ticketing & dynamic pricing
Dynamic pricing has evolved from isolated pilots into a core revenue-management tool. The Chicago Symphony Orchestra expanded its price categories from 13 to 20, adding USD 250,000 annually and boosting subscription retention to 87% . Regulatory initiatives, such as the United States' implementation of the Junk Fees Rule, aim to standardize price disclosures, thereby enhancing transparency in pricing mechanisms. This regulatory framework has increased consumer acceptance of algorithm-driven pricing adjustments by ensuring greater clarity. Venues are now utilizing advanced analytics to incorporate real-time demand metrics, competitor scheduling data, and weather forecasts into their pricing strategies. These data-driven approaches enable performing arts companies to optimize revenue generation, which, in turn, supports the expansion of their market size by facilitating the production of additional performances.
Competition from on-demand streaming entertainment
Streaming platforms are exerting pressure on leisure budgets and significantly reducing traditional release windows, leading to notable shifts in consumer behaviour. Academic research has identified a correlation between Netflix's entry into the U.S. market and a decline in cinema revenues, highlighting potential risks for adjacent live entertainment segments. However, complementary effects remain evident, as empirical studies indicate that live performances can drive increased demand for YouTube streaming by enhancing artist visibility and audience engagement. To address the risk of substitution, companies operating in the performing arts market are adopting strategic differentiation. These strategies include creating immersive and engaging atmospheres, leveraging hybrid live-broadcast formats, and fostering exclusive community-driven experiences that digital platforms are unable to replicate effectively.
Other drivers and restraints analyzed in the detailed report include:
- Growing corporate sponsorship & brand partnerships
- Government cultural funding & tax incentives
- Rising production & talent-insurance costs
For complete list of drivers and restraints, kindly check the Table Of Contents.
Segment Analysis
Music and Opera claimed 43.25% of performing art companies' market share in 2025, leveraging touring scalability and cross-brand collaborations that extend revenue beyond single venues. The segment's standardized technical requirements ease replication across markets, underpinning its lead in the performing arts companies market size. Dance, by contrast, posts the fastest 9.35% CAGR on the strength of visually dynamic choreography popularized through social media, which broadens reach to younger demographics. Theatre maintains stable volumes through subscription models and institutional subsidies, whereas Circus and Other Art Forms benefit from experiential tourism demand.
Technological advancements are significantly transforming the segment landscape. For instance, Stanford University's real-time AI script generator facilitates the creation of adaptive narratives, enhancing the efficiency and customization of content production. Similarly, Dresden's AI-composed opera aria exemplifies the potential of artificial intelligence in pushing the boundaries of artistic innovation. The increasing adoption of hybrid formats is further dissolving traditional disciplinary boundaries, compelling companies operating in the performing arts market to strategically reassess and refine their positioning to remain competitive and relevant in this evolving environment.
The Performing Arts Companies Market Segments Into by Type of Performing Arts (Theatre, Music and Opera, Dance, Circus and Other Art Forms), by Venue Type (Concert Halls, Theatres, Stadiums), Ticket Pricing (Premium, Mid-Range, Economy), and Geography (North America, Asia-Pacific, Europe, South America, Middle East and Africa). The Market Forecasts are Provided in Terms of Value (USD).
Geography Analysis
North America generated 37.40% of 2025 revenue on the back of Broadway's global brand recognition and an extensive corporate sponsorship network. Live Nation Entertainment manages an extensive portfolio of venues and facilitates the sale of over 620 million tickets annually. This operational scale underscores the company's ability to leverage regional advantages, enhancing its market presence and competitive edge within the global live entertainment industry. The company's expansive reach and ticketing capabilities position it as a dominant player, driving growth and reinforcing its leadership in the sector. Yet the U.S. Department of Justice antitrust suit filed in May 2024 challenges vertical integration and could democratize promoter competition. To sustain growth, North American operators are refining dynamic pricing, climate-proofing venues, and enhancing community outreach, all critical to maintaining share in the performing arts companies market.
Asia-Pacific stands as the fastest-growing territory, with an 8.05% CAGR through 2031 propelled by massive cultural infrastructure investments. From 1998 to 2015, China constructed 360 grand theatres, significantly exceeding the total built in Europe over the past 70 years. The growing prominence of concert tourism further drives market demand. For instance, Taylor Swift's residency in Singapore is anticipated to contribute hundreds of millions of dollars to the local GDP, highlighting the economic impact of such events. Additionally, the emergence of megacities provides densely populated consumer bases, ensuring a steady stream of growth opportunities for companies operating within the performing arts market.
- Live Nation Entertainment
- AEG Presents (Anschutz Entertainment Group)
- Cirque du Soleil Entertainment Group
- Ambassador Theatre Group
- Shubert Organization
- Nederlander Organization
- Stage Entertainment
- Disney Theatrical Group (The Walt Disney Company)
- Royal Opera House
- Metropolitan Opera
- National Theatre (UK)
- Paris Opera Ballet
- Bolshoi Theatre
- Berlin Philharmonic Foundation
- Sydney Opera House Trust
- Lincoln Center for the Performing Arts
- National Centre for the Performing Arts (China)
- Shanghai Grand Theatre Co.
- Tokyo Ballet Company
- Royal Shakespeare Company
Additional Benefits:
- The market estimate (ME) sheet in Excel format
- 3 months of analyst support
TABLE OF CONTENTS
1 Introduction
- 1.1 Study Assumptions & Market Definition
- 1.2 Scope of the Study
2 Research Methodology
3 Executive Summary
4 Market Landscape
- 4.1 Market Overview
- 4.2 Market Drivers
- 4.2.1 Post-pandemic rebound in live event attendance
- 4.2.2 Rise of digital ticketing & dynamic pricing
- 4.2.3 Growing corporate sponsorship & brand partnerships
- 4.2.4 Government cultural funding & tax incentives
- 4.2.5 Immersive XR-enabled hybrid performances
- 4.2.6 Expansion of performing arts in emerging megacities
- 4.3 Market Restraints
- 4.3.1 Competition from on-demand streaming entertainment
- 4.3.2 Rising production & talent-insurance costs
- 4.3.3 Climate-related disruptions to outdoor venues
- 4.3.4 Wage-inflation from talent unionization drives
- 4.4 Value / Supply-Chain Analysis
- 4.5 Regulatory Landscape
- 4.6 Technological Outlook
- 4.7 Porter's Five Forces
- 4.7.1 Threat of New Entrants
- 4.7.2 Bargaining Power of Suppliers
- 4.7.3 Bargaining Power of Buyers
- 4.7.4 Threat of Substitutes
- 4.7.5 Industry Rivalry
5 Market Size & Growth Forecasts
- 5.1 By Types of Performing Arts
- 5.1.1 Theater
- 5.1.2 Music and Opera
- 5.1.3 Dance
- 5.1.4 Circus and Other Art Forms
- 5.2 By Venue Type
- 5.2.1 Concert Halls
- 5.2.2 Theatres
- 5.2.3 Stadiums
- 5.3 By Ticket Pricing
- 5.3.1 Premium
- 5.3.2 Mid-range
- 5.3.3 Economy
- 5.4 By Geography
- 5.4.1 North America
- 5.4.1.1 Canada
- 5.4.1.2 United States
- 5.4.1.3 Mexico
- 5.4.2 South America
- 5.4.2.1 Brazil
- 5.4.2.2 Peru
- 5.4.2.3 Chile
- 5.4.2.4 Argentina
- 5.4.2.5 Rest of South America
- 5.4.3 Europe
- 5.4.3.1 United Kingdom
- 5.4.3.2 Germany
- 5.4.3.3 France
- 5.4.3.4 Spain
- 5.4.3.5 Italy
- 5.4.3.6 BENELUX
- 5.4.3.7 NORDICS
- 5.4.3.8 Rest of Europe
- 5.4.4 Asia-Pacific
- 5.4.4.1 India
- 5.4.4.2 China
- 5.4.4.3 Japan
- 5.4.4.4 Australia
- 5.4.4.5 South Korea
- 5.4.4.6 South East Asia
- 5.4.4.7 Rest of Asia-Pacific
- 5.4.5 Middle East & Africa
- 5.4.5.1 United Arab Emirates
- 5.4.5.2 Saudi Arabia
- 5.4.5.3 South Africa
- 5.4.5.4 Nigeria
- 5.4.5.5 Rest of Middle East & Africa
- 5.4.1 North America
6 Competitive Landscape
- 6.1 Market Concentration
- 6.2 Strategic Moves
- 6.3 Market Share Analysis
- 6.4 Company Profiles (includes Global level Overview, Market level overview, Core Segments, Financials as available, Strategic Information, Market Rank/Share for key companies, Products & Services, and Recent Developments)
- 6.4.1 Live Nation Entertainment
- 6.4.2 AEG Presents (Anschutz Entertainment Group)
- 6.4.3 Cirque du Soleil Entertainment Group
- 6.4.4 Ambassador Theatre Group
- 6.4.5 Shubert Organization
- 6.4.6 Nederlander Organization
- 6.4.7 Stage Entertainment
- 6.4.8 Disney Theatrical Group (The Walt Disney Company)
- 6.4.9 Royal Opera House
- 6.4.10 Metropolitan Opera
- 6.4.11 National Theatre (UK)
- 6.4.12 Paris Opera Ballet
- 6.4.13 Bolshoi Theatre
- 6.4.14 Berlin Philharmonic Foundation
- 6.4.15 Sydney Opera House Trust
- 6.4.16 Lincoln Center for the Performing Arts
- 6.4.17 National Centre for the Performing Arts (China)
- 6.4.18 Shanghai Grand Theatre Co.
- 6.4.19 Tokyo Ballet Company
- 6.4.20 Royal Shakespeare Company
7 Market Opportunities & Future Outlook
- 7.1 Monetization of immersive, mixed-reality ancillary content tied to live shows
- 7.2 Green-certified mobile venues for under-served secondary-cities touring circuits

