
PUBLISHER: Mordor Intelligence | PRODUCT CODE: 1911763

PUBLISHER: Mordor Intelligence | PRODUCT CODE: 1911763
Hardware Firewall - Market Share Analysis, Industry Trends & Statistics, Growth Forecasts (2026 - 2031)
The hardware firewall market was valued at USD 22.87 billion in 2025 and estimated to grow from USD 25.28 billion in 2026 to reach USD 41.62 billion by 2031, at a CAGR of 10.52% during the forecast period (2026-2031).
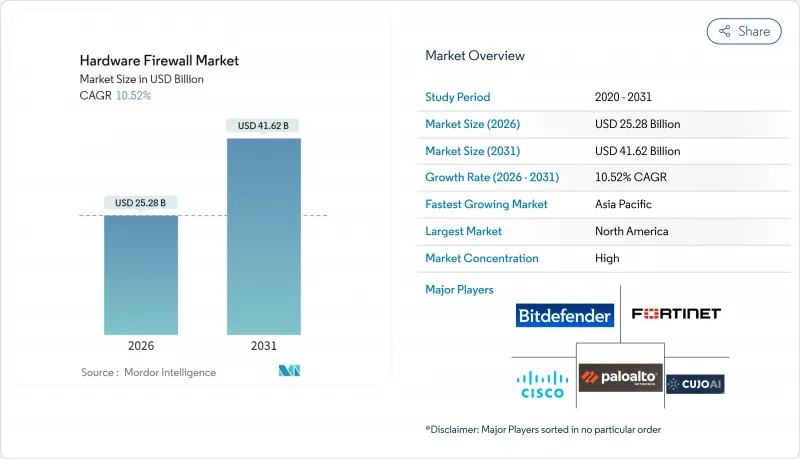
Accelerated demand arises from zero-trust mandates in federal and critical-infrastructure networks, edge-computing adoption, 5G densification, and the growing volume of encrypted traffic that now exceeds 90% of total data flows. Device/System hardware continues to dominate revenues, yet managed services expand faster as enterprises substitute capital purchases with outcome-based contracts. Large enterprises drive refresh cycles for terabit-class appliances, while SMEs fuel incremental growth by adopting simplified unified-threat platforms. Regionally, North America retains the lead, but Asia-Pacific registers the quickest expansion as China, India, and ASEAN members align regulatory frameworks with global cybersecurity norms.
Global Hardware Firewall Market Trends and Insights
Increasing Sophistication of Multi-Vector Cyber-Attacks Necessitating ASIC-Accelerated Inspection
Threat actors now combine ransomware, supply-chain exploits, and state-sponsored operations, overwhelming CPU-centric inspection engines. CISA documented 1,132 known exploited vulnerabilities in 2024, a 23% rise over 2023. Dedicated ASICs embedded in hardware appliances process encrypted traffic at line rate, enabling real-time threat mitigation without introducing latency. Fortinet's SP5 ASIC platform reaches 3.2 Tbps throughput with sub-microsecond inspection delays, exemplifying the leap in silicon-level security performance. Machine-learning inference integrated inside these chips supports behavioral detection of zero-day attacks that signature-based engines miss. NIST's Cybersecurity Framework 2.0 explicitly references hardware-accelerated controls for critical-infrastructure protection.
Government Zero-Trust Mandates for Federal and Critical-Infrastructure Networks
Executive Order 14028 obliges U.S. federal agencies to adopt zero-trust architectures by fiscal 2024, backed by USD 9.8 billion in modernization funding. The directive drives bulk procurement of high-throughput appliances capable of continuous verification, micro-segmentation, and encrypted-traffic analytics. Parallel mandates arise in defense contracting, where CMMC 2.0 requires hardware firewalls for Level 3 compliance across 220,000 suppliers. Europe's NIS2 Directive imposes comparable safeguards on essential services, broadening demand across the Atlantic. Hardware appliances have shifted from optional perimeter guards to indispensable enforcement nodes within government-regulated networks.
Rapid Shift to Firewall-as-a-Service Cannibalizing On-Premises Hardware Demand
Cloud-delivered security models erode demand for on-premise boxes among organizations seeking frictionless scalability. Zscaler's 2024 results showed 35% annual revenue growth, underscoring appetite for service-based offerings that eliminate hardware ownership. Mid-market firms with lean IT staff gravitate toward managed firewalls, although performance and data-sovereignty requirements still anchor many enterprises to on-prem hardware. The hardware firewall market therefore faces a bifurcated future where service models absorb low-to-mid range demand while high-performance needs remain appliance-centric.
Other drivers and restraints analyzed in the detailed report include:
- Edge-Computing and 5G Densification Requiring Distributed Micro-Firewall Nodes
- SD-WAN Replacement of MPLS Driving Hardware NGFW Refresh Cycles
- Supply-Chain Volatility for Network-Processing Chips
For complete list of drivers and restraints, kindly check the Table Of Contents.
Segment Analysis
Device/System hardware commanded 63.12% of the hardware firewall market in 2025 as enterprises prioritized ASIC-based throughput for encrypted-traffic inspection. Services, however, race ahead at a 12.72% CAGR as organizations outsource configuration, monitoring, and incident response to vendor-run centers. The hardware firewall market size for Services is on track to double by 2031 as outcome-based contracts displace capital expenditures. Large enterprises continue to refresh chassis-based boxes, but SMEs increasingly prefer vendor-hosted management that sidesteps staffing shortages.
Enterprises embracing zero-trust architectures deploy hardware appliances as enforcement nodes, then overlay managed detection and response subscriptions. Fortinet grew support-services revenue 23% year over year, signaling steady managed-services uptake. Integration complexity around AI-accelerated appliances further elevates demand for professional services. As 5G micro-sites proliferate, installation and lifecycle contracts will remain critical revenue anchors for service providers.
Large enterprises held 68.12% of the hardware firewall market share in 2025, reflecting global refresh cycles among banks, telcos, and hyperscale cloud providers. SMEs, though smaller in absolute spend, post a 12.94% CAGR that narrows the gap each year. The hardware firewall market size attributable to SMEs benefits from cloud-managed consoles that reduce administrative overhead and from vendor financing that converts upfront costs into subscription outlays.
Government grants and cyber-insurance mandates further pull SMEs into compliance regimes. The U.K. Cyber Security Breaches Survey 2024 found that 75% of SMEs now deploy at least one firewall, demonstrating penetration beyond early adopters. Vendors bundle simplified policy templates and automated updates to meet limited in-house expertise, while channel partners package firewalls with broadband circuits for turnkey protection.
The Hardware Firewall Market Report is Segmented by Component (Device/System and Services), Organization Size (SMEs and Large Enterprises), End-User Industry (BFSI, Healthcare, Manufacturing, Government and Defense, and More), Firewall Type (Packet-Filtering, Circuit-Level Gateways, Application-Level/Proxy, UTM, NGFW, and AI-Accelerated), and Geography. The Market Forecasts are Provided in Terms of Value (USD).
Geography Analysis
North America held 38.20% of hardware firewall market revenue in 2025, buoyed by USD 65 billion in federal cybersecurity spending and concentrated technology-sector demand. U.S. critical-infrastructure operators accelerate refresh cycles to align with CISA performance goals, while Canada expands public-sector investment through its Digital Charter. Mexican factories integrate firewalls into Industry 4.0 lines as the USMCA eases cross-border hardware flows.
Asia-Pacific records the fastest regional CAGR at 12.44% through 2031. China enforces its Data Security Law, obliging foreign and domestic firms to adopt certified network gear. India targets a USD 1 trillion digital economy by 2025, channeling incentives toward secure broadband and data-center build-outs. Japan's Society 5.0 pushes 5G and edge-computing, necessitating micro-firewall deployments across connected factories and smart-city grids. South Korea's K-Digital New Deal funds cyber-physical infrastructure that prefers on-premise protection over cloud.
Europe grows steadily on GDPR and NIS2 compliance requirements that emphasize data-sovereignty and hardware enforcement. Germany's Industry 4.0 and France's cloud-sovereignty programs propel enterprise spending on local inspection points. The U.K. National Cyber Strategy extends after Brexit, positioning domestic security vendors for government contracts. Middle East and Africa trails but accelerates as Saudi Arabia's Vision 2030 and the UAE's digital-nation roadmaps prioritize telecom-grade protection. African fintech adoption fuels purchases for mobile money platforms where packet loss equates to revenue loss.
- Fortinet Inc.
- Palo Alto Networks Inc.
- Cisco Systems Inc.
- Check Point Software Technologies Ltd.
- Juniper Networks Inc.
- Huawei Technologies Co. Ltd.
- Barracuda Networks Inc.
- SonicWall Inc.
- WatchGuard Technologies Inc.
- Sophos Ltd.
- F5 Inc.
- Forcepoint LLC
- Hillstone Networks Co. Ltd.
- TopSec Technology Group Inc.
- AhnLab Inc.
- Ubiquiti Inc.
- Netgate (Electric Sheep Fencing LLC)
- CUJO LLC
- Bitdefender SRL
- Zscaler Inc.
- Array Networks Inc.
- Sangfor Technologies Inc.
- Stormshield (Airbus CyberSecurity)
Additional Benefits:
- The market estimate (ME) sheet in Excel format
- 3 months of analyst support
TABLE OF CONTENTS
1 INTRODUCTION
- 1.1 Study Assumptions and Market Definition
- 1.2 Scope of the Study
2 RESEARCH METHODOLOGY
3 EXECUTIVE SUMMARY
4 MARKET LANDSCAPE
- 4.1 Market Overview
- 4.2 Market Drivers
- 4.2.1 Increasing sophistication of multi-vector cyber-attacks necessitating ASIC-accelerated inspection
- 4.2.2 Government zero-trust mandates for federal and critical-infrastructure networks
- 4.2.3 Edge-computing and 5G densification requiring distributed micro-firewall nodes
- 4.2.4 Reshoring incentives and tariffs spurring domestic appliance production
- 4.2.5 SD-WAN replacement of MPLS driving hardware NGFW refresh cycles
- 4.2.6 Falling AI-coprocessor costs enabling mid-market terabit-class appliances
- 4.3 Market Restraints
- 4.3.1 Rapid shift to Firewall-as-a-Service cannibalising on-prem hardware demand
- 4.3.2 Supply-chain volatility for network-processing chips
- 4.3.3 Privacy-driven limits on encrypted-traffic inspection
- 4.3.4 Rising energy costs of high-throughput appliances
- 4.4 Industry Value Chain Analysis
- 4.5 Regulatory Landscape
- 4.6 Technological Outlook
- 4.7 Porter's Five Forces Analysis
- 4.7.1 Bargaining Power of Suppliers
- 4.7.2 Bargaining Power of Buyers
- 4.7.3 Threat of New Entrants
- 4.7.4 Threat of Substitute Products
- 4.7.5 Intensity of Competitive Rivalry
5 MARKET SIZE AND GROWTH FORECASTS (VALUE)
- 5.1 By Component
- 5.1.1 Device / System
- 5.1.2 Services (Installation, Support, Managed)
- 5.2 By Organization Size
- 5.2.1 Small and Medium-sized Enterprises (SMEs)
- 5.2.2 Large Enterprises
- 5.3 By End-user Industry
- 5.3.1 BFSI
- 5.3.2 Healthcare
- 5.3.3 Manufacturing
- 5.3.4 Government and Defense
- 5.3.5 IT and Telecom
- 5.3.6 Retail and E-commerce
- 5.3.7 Education
- 5.4 By Firewall Type
- 5.4.1 Packet-Filtering Firewalls
- 5.4.2 Circuit-Level Gateways
- 5.4.3 Application-Level / Proxy Firewalls
- 5.4.4 Unified Threat Management (UTM)
- 5.4.5 Next-Generation Firewalls (NGFW)
- 5.4.6 AI-Accelerated / Terabit-class Firewalls
- 5.5 By Geography
- 5.5.1 North America
- 5.5.1.1 United States
- 5.5.1.2 Canada
- 5.5.1.3 Mexico
- 5.5.2 South America
- 5.5.2.1 Brazil
- 5.5.2.2 Argentina
- 5.5.2.3 Rest of South America
- 5.5.3 Europe
- 5.5.3.1 United Kingdom
- 5.5.3.2 Germany
- 5.5.3.3 France
- 5.5.3.4 Italy
- 5.5.3.5 Spain
- 5.5.3.6 Netherlands
- 5.5.3.7 Rest of Europe
- 5.5.4 Asia-Pacific
- 5.5.4.1 China
- 5.5.4.2 Japan
- 5.5.4.3 South Korea
- 5.5.4.4 India
- 5.5.4.5 ASEAN
- 5.5.4.6 Rest of Asia-Pacific
- 5.5.5 Middle East and Africa
- 5.5.5.1 Middle East
- 5.5.5.1.1 Saudi Arabia
- 5.5.5.1.2 United Arab Emirates
- 5.5.5.1.3 Turkey
- 5.5.5.1.4 Rest of Middle East
- 5.5.5.2 Africa
- 5.5.5.2.1 South Africa
- 5.5.5.2.2 Nigeria
- 5.5.5.2.3 Kenya
- 5.5.5.2.4 Rest of Africa
- 5.5.5.1 Middle East
- 5.5.1 North America
6 COMPETITIVE LANDSCAPE
- 6.1 Market Concentration
- 6.2 Strategic Moves
- 6.3 Market Share Analysis
- 6.4 Company Profiles (includes Global level Overview, Market level overview, Core Segments, Financials as available, Strategic Information, Market Rank/Share for key companies, Products and Services, and Recent Developments)
- 6.4.1 Fortinet Inc.
- 6.4.2 Palo Alto Networks Inc.
- 6.4.3 Cisco Systems Inc.
- 6.4.4 Check Point Software Technologies Ltd.
- 6.4.5 Juniper Networks Inc.
- 6.4.6 Huawei Technologies Co. Ltd.
- 6.4.7 Barracuda Networks Inc.
- 6.4.8 SonicWall Inc.
- 6.4.9 WatchGuard Technologies Inc.
- 6.4.10 Sophos Ltd.
- 6.4.11 F5 Inc.
- 6.4.12 Forcepoint LLC
- 6.4.13 Hillstone Networks Co. Ltd.
- 6.4.14 TopSec Technology Group Inc.
- 6.4.15 AhnLab Inc.
- 6.4.16 Ubiquiti Inc.
- 6.4.17 Netgate (Electric Sheep Fencing LLC)
- 6.4.18 CUJO LLC
- 6.4.19 Bitdefender SRL
- 6.4.20 Zscaler Inc.
- 6.4.21 Array Networks Inc.
- 6.4.22 Sangfor Technologies Inc.
- 6.4.23 Stormshield (Airbus CyberSecurity)
7 MARKET OPPORTUNITIES AND FUTURE OUTLOOK
- 7.1 White-space and Unmet-need Assessment

