
PUBLISHER: Mordor Intelligence | PRODUCT CODE: 1911828

PUBLISHER: Mordor Intelligence | PRODUCT CODE: 1911828
Refillable And Reusable Packaging - Market Share Analysis, Industry Trends & Statistics, Growth Forecasts (2026 - 2031)
The refillable and reusable packaging market is expected to grow from USD 118.3 billion in 2025 to USD 129.76 billion in 2026 and is forecast to reach USD 206.06 billion by 2031 at 9.69% CAGR over 2026-2031.
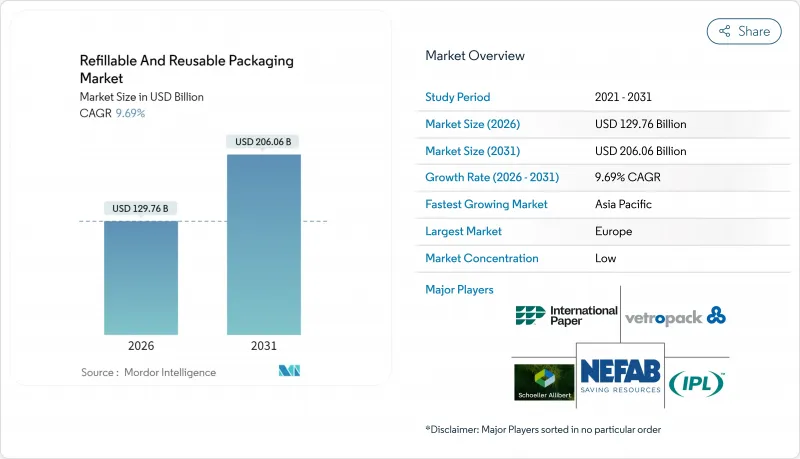
The refillable and reusable packaging market is gaining speed because circular-economy regulations, supply-chain cost pressures, and consumer sustainability preferences now converge across advanced and emerging economies. Legislative certainty in Europe, green-parcel mandates in China, and technology breakthroughs in cleaning and tracing solutions accelerate adoption despite lingering infrastructure gaps. Companies treat returnable assets as levers for lower total logistics spend, reduced raw-material volatility, and stronger brand equity, while investors reward measurable waste reduction with cheaper capital. Competitive activity focuses on embedding IoT sensors, predictive analytics, and turnkey washing services to maximize asset utilization and compliance reporting.
Global Refillable And Reusable Packaging Market Trends and Insights
Legislative Push Towards Circular-Economy Mandates
Extended producer responsibility policies now require companies to internalize end-of-life costs. The European Union mandates 65% material recycling by 2025 and 90% reuse for transport packaging by 2030. China's express-delivery regulation requires logistics providers to achieve a 95% reusable-packaging rate for intra-city parcels, unlocking a USD 12 billion addressable market for returnable containers. These rules tilt total-cost-of-ownership models toward reusable formats as disposal fees and carbon pricing rise.
Cost Savings from Closed-Loop Supply Chains
Operational data confirm that reusable assets lower freight bills, labor time, and write-offs. A CHEP automotive program increased truck utilization to 95% while cutting loading time by 75%, saving tier-one suppliers USD 2.3 million each year. CEVA Logistics reports 60% emission cuts and rapid payback when IoT-tracked boxes replace single-use cartons. In high-velocity loops, investments are typically recovered within 18 months.
High Reverse-Logistics Costs
Return networks can triple handling expenses relative to outbound flows, especially where route density is low. Cold-chain returns further elevate costs, pushing some brands to restrict reuse programs to high-volume urban corridors.
Other drivers and restraints analyzed in the detailed report include:
- Consumer Preference for Sustainable Brands
- Emerging IoT-Enabled Refill-on-the-Go Retail
- Ambiguity in Food-Contact Reuse Standards
For complete list of drivers and restraints, kindly check the Table Of Contents.
Segment Analysis
Plastic held 48.85% of the refillable and reusable packaging market share in 2025, thanks to polypropylene and polyethylene containers that survive high cycle counts while aligning with automation systems. Lightweight designs reduce freight emissions and total cost. Glass, though heavier, records a 12.18% CAGR because luxury beverages and skincare prioritize purity and premium feel. Vetropack's lightweight flint technology narrows freight gaps while protecting brand aesthetics.Metal drums and totes remain staples in chemicals where durability outranks weight, and paper-based corrugates secure specialized roles in automotive part shuttles.
Sustainability scrutiny of food-contact recycled plastics may gradually shift some brands toward glass and metal, yet advanced polymers embedded with IoT tags cement plastics' role in high-velocity loops. Consequently, the refillable and reusable packaging market balances cost efficiency, branding needs, and regulatory compliance as material science progresses.
The Refillable and Reusable Packaging Market Report is Segmented by Material (Plastic, Paper and Paperboard, and More), Product (Bottles and Containers, Pallets and Crates, Ibcs, Drums and Barrels, and More), End-User Industry (Food and Beverage, Cosmetics and Personal Care, Household Care, Chemicals and Petrochemicals, Building and Construction, and More), and Geography. The Market Forecasts are Provided in Terms of Value (USD).
Geography Analysis
Europe captured 34.08% of the refillable and reusable packaging market share in 2025, reflecting decades of policy layering and infrastructure investment. The EU's 90% transport-packaging reuse mandate for 2030 anchors long-term corporate budgets. Germany's pooling alliances lower crate turnaround times to 2.4 days, while France partners with luxury houses to pilot high-end glass refill systems. The United Kingdom channels USD 50 million into flexible-plastic recycling capacity, reinforcing domestic circularity.
Asia-Pacific leads growth at a 10.55% CAGR to 2031. China's 95% intra-city parcel-reuse rule yields a USD 12 billion market for foldable totes that fit last-mile bikes. Japan extends producer-responsibility fees to electronics, stimulating reusable transport packaging, while India's manufacturing expansion boosts demand for returnable automotive racks. South Korea integrates IoT tags and blockchain tracing into clean-room container pools, and Southeast Asia receives foreign investment for regional wash depots.
North America shows steady progress driven by corporate climate pledges and state-level Extended Producer Responsibility laws. Dispatch Goods raised venture funding to tackle part of the USD 335 billion packaging-waste problem through restaurant container sharing. Canada promotes refill pilots in resource industries, and Mexico scales century-old glass-bottle loops into app-based return systems. Latin America's emerging rollouts in Brazil and Mexico draw on beverage-crate heritage and rising urban eco-awareness. The Middle East and Africa, still nascent, attract interest as retailers test closed-loop water-jug fleets.
- Schoeller Allibert Services BV
- International Paper
- Nefab Group
- IPL Inc.
- Vetropack Holding Ltd
- Mondi PLC
- Greif Inc.
- IFCO Systems
- Smurfit WestRock
- GWP Group
- Orbis Corporation
- Petainer Ltd
- Refillism
- Amcor PLC
- Bormioli Luigi Corporation
- Jiangmen UA Packaging Co. Ltd
- Loop Industries Inc.
- RePack Oy
- EcoEnclose LLC
Additional Benefits:
- The market estimate (ME) sheet in Excel format
- 3 months of analyst support
TABLE OF CONTENTS
1 INTRODUCTION
- 1.1 Study Assumptions and Market Definition
- 1.2 Scope of the Study
2 RESEARCH METHODOLOGY
3 EXECUTIVE SUMMARY
4 MARKET LANDSCAPE
- 4.1 Market Overview
- 4.2 Market Drivers
- 4.2.1 Legislative push towards circular-economy mandates
- 4.2.2 Cost savings from closed-loop supply chains
- 4.2.3 Consumer preference for sustainable brands
- 4.2.4 Emerging IoT-enabled refill-on-the-go retail
- 4.2.5 ESG-linked zero-waste corporate financing
- 4.2.6 Polymer-to-polymer cleaning breakthroughs
- 4.3 Market Restraints
- 4.3.1 High reverse-logistics costs
- 4.3.2 Ambiguity in food-contact reuse standards
- 4.3.3 Microbial-contamination risks in tropical zones
- 4.3.4 Fragmented track-and-trace data protocols
- 4.4 Industry Supply Chain Analysis
- 4.5 Regulatory Landscape
- 4.6 Technological Outlook
- 4.7 Porter's Five Forces Analysis
- 4.7.1 Bargaining Power of Suppliers
- 4.7.2 Bargaining Power of Consumers
- 4.7.3 Threat of New Entrants
- 4.7.4 Threat of Substitute Products
- 4.7.5 Intensity of Competitive Rivalry
5 MARKET SIZE AND GROWTH FORECASTS
- 5.1 By Material
- 5.1.1 Plastic
- 5.1.2 Paper and Paperboard
- 5.1.3 Metal
- 5.1.4 Glass
- 5.2 By Product
- 5.2.1 Bottles and Containers
- 5.2.2 Pallets and Crates
- 5.2.3 Intermediate Bulk Containers (IBCs)
- 5.2.4 Drums and Barrels
- 5.2.5 Boxes and Cartons
- 5.2.6 Cans and Pails
- 5.2.7 Other Products (Tubes, Pouches, Bags and Sacks, etc.)
- 5.3 By End-user Industry
- 5.3.1 Food and Beverage
- 5.3.2 Cosmetics and Personal Care
- 5.3.3 Household Care
- 5.3.4 Chemicals and Petrochemicals
- 5.3.5 Building and Construction
- 5.3.6 Shipping and Transportation
- 5.3.7 Other End-user Industries (Automotive, Pharmaceuticals, etc.)
- 5.4 By Geography
- 5.4.1 North America
- 5.4.1.1 United States
- 5.4.1.2 Canada
- 5.4.1.3 Mexico
- 5.4.2 South America
- 5.4.2.1 Brazil
- 5.4.2.2 Argentina
- 5.4.2.3 Rest of South America
- 5.4.3 Europe
- 5.4.3.1 Germany
- 5.4.3.2 United Kingdom
- 5.4.3.3 France
- 5.4.3.4 Italy
- 5.4.3.5 Spain
- 5.4.3.6 Russia
- 5.4.3.7 Rest of Europe
- 5.4.4 Asia Pacific
- 5.4.4.1 China
- 5.4.4.2 Japan
- 5.4.4.3 India
- 5.4.4.4 South Korea
- 5.4.4.5 South-East Asia
- 5.4.4.6 Rest of Asia Pacific
- 5.4.5 Middle East and Africa
- 5.4.5.1 Middle East
- 5.4.5.1.1 Saudi Arabia
- 5.4.5.1.2 United Arab Emirates
- 5.4.5.1.3 Turkey
- 5.4.5.1.4 Rest of Middle East
- 5.4.5.2 Africa
- 5.4.5.2.1 South Africa
- 5.4.5.2.2 Nigeria
- 5.4.5.2.3 Rest of Africa
- 5.4.5.1 Middle East
- 5.4.1 North America
6 COMPETITIVE LANDSCAPE
- 6.1 Market Concentration
- 6.2 Strategic Moves
- 6.3 Market Share Analysis
- 6.4 Company Profiles (includes Global level Overview, Market level overview, Core Segments, Financials as available, Strategic Information, Market Rank/Share for key companies, Products and Services, and Recent Developments)
- 6.4.1 Schoeller Allibert Services BV
- 6.4.2 International Paper
- 6.4.3 Nefab Group
- 6.4.4 IPL Inc.
- 6.4.5 Vetropack Holding Ltd
- 6.4.6 Mondi PLC
- 6.4.7 Greif Inc.
- 6.4.8 IFCO Systems
- 6.4.9 Smurfit WestRock
- 6.4.10 GWP Group
- 6.4.11 Orbis Corporation
- 6.4.12 Petainer Ltd
- 6.4.13 Refillism
- 6.4.14 Amcor PLC
- 6.4.15 Bormioli Luigi Corporation
- 6.4.16 Jiangmen UA Packaging Co. Ltd
- 6.4.17 Loop Industries Inc.
- 6.4.18 RePack Oy
- 6.4.19 EcoEnclose LLC
7 MARKET OPPORTUNITIES AND FUTURE OUTLOOK
- 7.1 White-space and Unmet-need Assessment

