
PUBLISHER: Mordor Intelligence | PRODUCT CODE: 1934620

PUBLISHER: Mordor Intelligence | PRODUCT CODE: 1934620
Soybean - Market Share Analysis, Industry Trends & Statistics, Growth Forecasts (2026 - 2031)
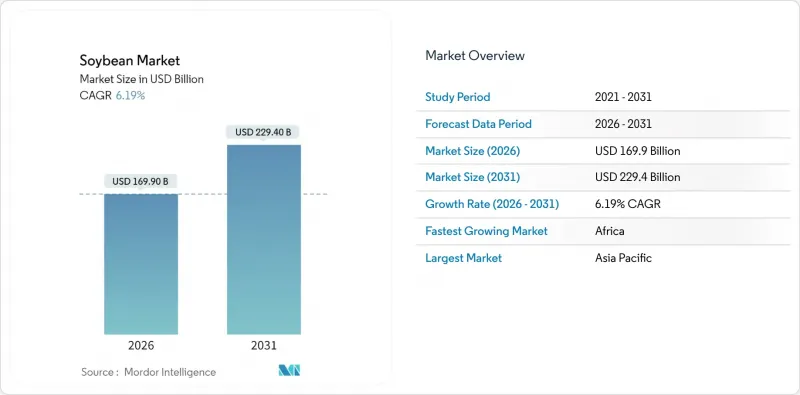
Soybean market size in 2026 is estimated at USD 169.9 billion, growing from 2025 value of USD 160 billion with 2031 projections showing USD 229.4 billion, growing at 6.19% CAGR over 2026-2031.
Upbeat demand for high-protein feed, rapid biofuel adoption, and steady plant-based food growth continue to reshape supply chains, pricing, and processing strategies within the soybean market. Crushing margins remain attractive as soybean oil's share of United States biofuel feedstocks climbed from less than 1% in 2001 to 46% in 2024, incentivizing a wave of refinery-linked crush projects. On the supply side, record Brazilian harvests and United States productivity gains keep aggregate supplies comfortable, although extreme weather and logistics bottlenecks still trigger episodic price volatility. Competition pivots on traceability, climate-smart traits, and synchronized investments that capture value across meal, oil, and specialty soy streams.
Global Soybean Market Trends and Insights
Expansion of Biofuel Mandates Boosting Soybean-Oil Demand
Stronger renewable fuel standards in the United States, the European Union, and Brazil have repositioned soybean oil from a meal by-product to a strategic energy feedstock. The United States Environmental Protection Agency established a biomass-based diesel requirement of 7.12 billion RINs (Renewable Identification Numbers) for 2026. This target necessitates approximately 5.6 billion gallons of biodiesel production and the processing of up to 524 million additional bushels. Renewable diesel output surpassed traditional biodiesel at 2.3 billion gallons in 2024, and soybean oil supplied 28% of that total . Rapid demand growth lifted soybean oil prices 6.2% in a single trading session after the 2025 quota proposal, tightening the linkage between fuel policy and oilseed pricing. Refiners recently co-invest with crushers to secure feedstock and carbon-intensity data, creating integrated hubs that maximize crush margins and shorten supply chains. Food manufacturers increasingly hedge exposure through long-term supply agreements to safeguard edible-oil availability as fuel consumption accelerates.
Growth in High-Protein Animal Feed (Soybean Meal) Usage
Global protein demand keeps soybean meal at the core of poultry and swine rations. United States soybean meal exports reached 14.4 million metric tons valued at USD 6.7 billion in 2024, 10% above the prior year despite flat whole-bean shipments. Rising incomes in Southeast Asia and South America are driving per-capita meat intake, reinforcing continuous feed demand that buffers crushers from oil-price swings. Chinese pork herd recovery has stabilized soymeal import needs, while domestic feed companies increasingly specify de-hulled United States meal for its higher digestible amino-acid profile. Record Brazil supplies temper price spikes, but importers still pay quality premiums to diversify origin risk amid trade uncertainties.
Climate-Change-Driven Yield Variability and Extreme Weather
Unpredictable rainfall and heat waves curbed Brazil's 2024 harvest by 6% to 153 million metric tons as Southern states battled floods during pod fill. Drought models forecast up to 40% yield loss in the American Midwest under high-temperature scenarios, prompting crop-insurance recalibration and varietal shifts. Moisture stress also lowers oil-to-protein ratios, complicating crushers' product-mix planning. Investment in irrigation and climate-resilient genetics partially offsets risk but raises capital costs for growers and processors.
Other drivers and restraints analyzed in the detailed report include:
- Rising Demand for Plant-Based Protein and Dairy Substitutes
- Commercialization of Drought-Tolerant, High-Yield Cultivars
- Commodity-Price Volatility Driven by Speculative Trading
For complete list of drivers and restraints, kindly check the Table Of Contents.
Segment Analysis
The Soybean Market Report is Segmented by Geography (North America, Europe, Asia-Pacific, and More). The Report Includes Production Analysis (Volume), Consumption Analysis (Value and Volume), Export Analysis (Value and Volume), Import Analysis (Value and Volume), and Price Trend Analysis. The Market Forecasts are Provided in Terms of Value (USD) and Volume (Metric Tons).
Geography Analysis
Asia-Pacific controlled 44.70% of the soybean market demand in 2025 on the strength of China's import program that routinely exceeds 100 million metric tons. Government incentives under the Soybean Oilseed Capacity Improvement Project aim to lift domestic output, but structural land and climate constraints keep import reliance high. Japan remains the largest destination for Non-GMO (Genetically Modified Organism) food-grade soybeans, paying premiums that filter through the entire traceability chain. India's dependence on imported soybean oil has deepened as domestic yields plateau, while Southeast Asian crushers expand meal output for regional livestock hubs.
Africa, though representing a small base, is the fastest-growing region with a 7.58% CAGR to 2031. Malawi began direct export lanes to China in 2024, and Nigeria's Central Bank-backed anchor-borrower programs expand acreage. Opportunities stem from 445 million hectares of suitable but uncultivated land and improving port infrastructure under the African Continental Free Trade Area framework. Development agencies and private investors collaborate on integrated value chains that include local crushing to retain value and shorten feedstock logistics for domestic poultry and aquaculture sectors.
South America remains the production powerhouse. Brazil is projected to harvest 167.3 million metric tons in 2025 and account for nearly 60% of global exports. Strengthening rail links from Mato Grosso to northern ports reduces freight to Asian destinations and underpins competitive FOB (Free On Board) prices. Argentina stabilizes at roughly 49 million metric tons following tax-policy reforms that encourage meal exports over raw-bean sales. North America continues incremental gains, the United States anticipates a 4.3 billion-bushel crop in 2025 despite acreage shifts, supported by precision-ag adoption and robust domestic crush expansion.
- Market Overview
- Market Drivers
- Market Restraints
- Value/Supply-Chain Analysis
- Regulatory Landscape
- Technological Outlook
- PESTEL Analysis
- List of Key Stakeholders
Additional Benefits:
- The market estimate (ME) sheet in Excel format
- 3 months of analyst support
TABLE OF CONTENTS
1 Introduction
- 1.1 Study Assumptions and Market Definition
- 1.2 Scope of the Study
2 Research Methodology
3 Executive Summary
4 Market Landscape
- 4.1 Market Overview
- 4.2 Market Drivers
- 4.2.1 Expansion of biofuel mandates boosting soybean-oil demand
- 4.2.2 Growth in high-protein animal feed (soybean meal) usage
- 4.2.3 Rising demand for plant-based protein and dairy substitutes
- 4.2.4 Commercialization of drought-tolerant, high-yield cultivars
- 4.2.5 Blockchain-based traceability premiums for deforestation-free soy
- 4.2.6 Localized crush-plant build-outs reducing logistics cost
- 4.3 Market Restraints
- 4.3.1 Climate-change-driven yield variability and extreme weather
- 4.3.2 Commodity-price volatility driven by speculative trading
- 4.3.3 Consumer backlash against genetically modified soybeans
- 4.3.4 Stricter marine-emission rules raising trans-ocean shipping costs
- 4.4 Value/Supply-Chain Analysis
- 4.5 Regulatory Landscape
- 4.6 Technological Outlook
- 4.7 PESTEL Analysis
5 Market Size and Growth Forecasts (Production Analysis (Volume), Consumption Analysis (Volume and Value), Import Analysis (Volume and Value), Export Analysis (Volume and Value), and Price Trend Analysis)
- 5.1 By Geography
- 5.1.1 North America
- 5.1.1.1 United States
- 5.1.1.2 Canada
- 5.1.1.3 Mexico
- 5.1.2 Europe
- 5.1.2.1 Russia
- 5.1.2.2 Italy
- 5.1.2.3 Ukraine
- 5.1.2.4 Spain
- 5.1.3 Asia-Pacific
- 5.1.3.1 China
- 5.1.3.2 India
- 5.1.3.3 Japan
- 5.1.3.4 Australia
- 5.1.4 South America
- 5.1.4.1 Brazil
- 5.1.4.2 Argentina
- 5.1.4.3 Paraguay
- 5.1.5 Middle East
- 5.1.5.1 Saudi Arabia
- 5.1.5.2 United Arab Emirates
- 5.1.6 Africa
- 5.1.6.1 South Africa
- 5.1.6.2 Egypt
- 5.1.1 North America
6 Competitive Landscape
- 6.1 List of Key Stakeholders
- 6.1.1 Bunge Global SA
- 6.1.2 Louis Dreyfus Company (LDC)
- 6.1.3 Cargill, Incorporated.
- 6.1.4 Archer Daniels Midland Co (ADM)
- 6.1.5 COFCO International Ltd.
- 6.1.6 AMAGGI Group
- 6.1.7 SLC Agricola
- 6.1.8 Round Table on Responsible Soy (RTRS)
- 6.1.9 Wilmar International Ltd.
- 6.1.10 Amaggi Group
- 6.1.11 Savaliya Agri Commodity Export Pvt Ltd.
7 Market Opportunities and Future Outlook

