
PUBLISHER: Mordor Intelligence | PRODUCT CODE: 1934703

PUBLISHER: Mordor Intelligence | PRODUCT CODE: 1934703
Stone Flooring - Market Share Analysis, Industry Trends & Statistics, Growth Forecasts (2026 - 2031)
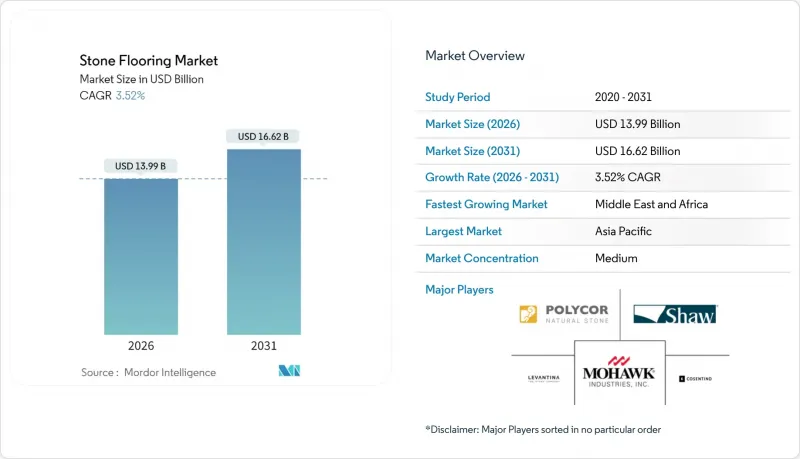
The stone flooring market was valued at USD 13.51 billion in 2025 and estimated to grow from USD 13.99 billion in 2026 to reach USD 16.62 billion by 2031, at a CAGR of 3.52% during the forecast period (2026-2031).
Growth reflects a maturing landscape in which premium positioning, sustainable sourcing, and technology-enabled fabrication outweigh volume-driven competition. Suppliers that leverage automation in cutting and finishing operations are widening cost advantages while meeting stricter tolerance requirements for large-format panels. Policy incentives for heritage renovation in Europe, a resurgent global hotel pipeline, and an under-supplied United States housing market together form a demand backbone that cushions cyclical slowdowns. However, tariff volatility on Chinese dimensional stone, an acute installer labor shortage, and fast-rising adoption of stone-plastic-composite (SPC) flooring challenge traditional revenue models. Competitive intensity remains moderate; leading firms are reallocating capital toward sustainability, regional production, and digitally enabled services to defend share and lift margins.
Global Stone Flooring Market Trends and Insights
Surging Luxury Housing Completions in Tier-2 United States Metros
Secondary United States metros such as Austin, Nashville, and Charlotte are attracting developers that once focused on coastal cities. Even after a 40% dip in Austin's new-build transactions during 2024, the national housing shortage of about 4.5 million units points to resilient long-run demand. Builders in these markets favor stone flooring for upscale finishes that differentiate their offerings, particularly in open-plan kitchens and outdoor living areas where durability matters. Suppliers with flexible logistics can capture margin when speculative projects liquidate inventory during down cycles, then scale up rapidly when permits rebound. Regional players gain first-mover advantages by tailoring assortments to local design codes and climate demands while larger brands remain fixated on primary markets. As land constraints tighten in Tier-1 cities, investment migrates inland, sustaining the stone flooring market across a broader customer base.
Tax-Rebate Programs for Historic-Building Renovations in EU
European Union member states increasingly deploy fiscal incentives to preserve architectural heritage, creating specialized demand channels for authentic stone materials that comply with historical accuracy requirements. The zero VAT rate applicable to approved alterations of protected buildings in the UK exemplifies how regulatory frameworks can stimulate premium stone demand, particularly for projects requiring specific quarry sources or traditional finishing techniques. These programs often mandate the use of original stone types and traditional installation methods, creating barriers to entry for engineered alternatives while supporting premium pricing for authentic materials. The complexity of heritage compliance requirements favors established stone suppliers with documented provenance and technical expertise in historical restoration techniques.
Volatile Import Tariffs on Chinese Dimensional Stone
United States tariffs on some Chinese stone grades escalated to 145% in 2025, while duties on Indian and EU stone range between 20% and 26%, distorting global trade flows. Mohawk Industries cited USD 50 million in tariff costs for Q1 2025 despite its sizable domestic footprint. Large distributors pre-buy during tariff lulls, lifting inventories and warehousing costs, whereas smaller importers risk bankruptcy amid price spikes, accelerating consolidation. Projects with locked construction budgets face change-order disputes when material costs surge. Companies that own quarries in Turkey, Spain, or inside the United States have more bargaining power, but they still face a shortage of shipping containers and higher domestic transport costs. Because trade negotiations are still unsettled, delivered prices and delivery schedules remain unpredictable for everyone in the stone flooring market.
Other drivers and restraints analyzed in the detailed report include:
- Rapid Hotel Pipeline Expansion Across GCC States
- Rising Adoption of Large-Format Gauged Stone Panels
- Labor Shortages in Qualified Stone Installers
For complete list of drivers and restraints, kindly check the Table Of Contents.
Segment Analysis
Marble retained 32.20% of stone flooring market share in 2025 on the back of its timeless luxury appeal, yet engineered composites are accelerating at a 5.26% CAGR, notably above the stone flooring market growth trajectory. Granite stays resilient where foot-traffic durability is paramount, while limestone and travertine appeal to Mediterranean-inspired residences. Slate and sandstone remain niche, valued for slip resistance and rustic aesthetics. Engineered quartz and sintered-stone products replicate veining with near-zero porosity, winning specification in hospitality bathrooms and multifamily kitchens. Advances in low-silica formulations reduce occupational health risks flagged by several United States agencies, easing regulatory headwinds. As fabrication plants integrate automation and closed-loop water recycling, production yields rise and waste declines, allowing competitive pricing without compromising margins.
Growth prospects for engineered stone hinge on continuous design innovation that stays ahead of counterfeit laminates. Suppliers coupling augmented-reality visualization with speedy sample fulfillment influence early design decisions, locking in orders before site measurement. Marble quarries, in response, promote traceable origin stories and carbon-footprint disclosures to justify premium pricing. They also co-develop hybrid assemblies-thin-cut marble reinforced with aluminum honeycomb-to compete on weight and installation speed. Long term, the two categories will coexist, but share shifts toward composites will intensify if silica-free chemistries achieve parity in color depth and edge polish quality.
Residential buyers represented 57.40% of the stone flooring market size in 2025, yet commercial demand is pacing ahead at a 6.03% CAGR through 2031. Hotels, office lobbies, and higher-education facilities specify natural stone for brand elevation and lifecycle durability. Renovations across aging healthcare campuses underscore hygiene imperatives met by low-porosity granite and quartz. Conversely, high mortgage rates and consumer caution curb new single-family starts, muting near-term residential volume. Remodeling, which accounts for 80% of flooring spend, remains subdued but stores latent demand that should unlock once interest rates soften.
Commercial buyers offer larger lot sizes and tighter schedule adherence, favoring suppliers with in-house drafting and just-in-time delivery. Product warranties exceeding 10 years, coupled with service contracts, open annuity revenue streams. Residential channels, especially DIY-oriented home centers, pivot toward click-together engineered stone panels that minimize professional labor needs. Strategic partnerships with builders for design-center displays keep natural stone visible to homebuyers who might otherwise default to SPC or luxury vinyl tile.
The Stone Flooring Market Report is Segmented by Product Type (Marble, Granite, Slate, Sandstone, and More), End User (Residential, Commercial), Construction Type (New Construction, Remodeling/Retrofit), Distribution Channel (B2C/Retail Consumers, B2B/Contractors/Builders), and Geography (North America, South America, Europe, Asia-Pacific, and More). The Market Forecasts are Provided in Terms of Value (USD).
Geography Analysis
Asia-Pacific preserved a commanding 41.05% share in 2025, buoyed by China's vertically integrated stone cluster and India's specialty granite exports, though both contend with United States tariffs of up to 145% and 26% respectively. [4]. Regional labor-cost advantages offset shipping premiums, and localized e-commerce portals are opening emerging Southeast Asian markets. Meanwhile, the stone flooring market size for the Middle East and Africa is forecast to rise fastest at 4.47% CAGR, underpinned by a record hotel construction pipeline and government-backed quarry licensing in Saudi Arabia. African infrastructure outlays, evidenced by cement demand climbing from USD 35.0 billion in 2024 to USD 42.0 billion by 2030, further expand addressable volumes.
North America faces mixed conditions: elevated mortgage rates dampen housing starts, but pent-up demand remains due to a 4.5 million-unit shortage. The United States remodel sector turns cautious, yet public-sector renovation budgets continue flowing into courthouses and schools. Europe benefits from renovation tax rebates and growing carbon-footprint scrutiny that nudges specifiers toward locally quarried stone, reducing transport emissions. Firms that certify Environmental Product Declarations gain an edge in tenders bound by EU Climate Law targets.
- Antolini Luigi & C. S.p.A.
- Arizona Tile, LLC
- Aro Granite Industries Ltd.
- Bedrosians Tile & Stone
- Caesarstone Ltd.
- Cambria Company LLC
- Cosentino S.A.
- Dal-Tile Corporation
- Dimpomar
- Finstone Group
- Florim S.p.A.
- Fox Marble Holdings plc
- Johnson Tiles
- Laticrete International, Inc.
- Levantina y Asociados de Minerales, S.A.
- Mohawk Industries
- MSI Surfaces
- Polycor Inc.
- Porcelanosa Grupo
- R.E.D. Graniti S.p.A.
- Shaw Industries
- Santucci Group
- Temmer
- Topalidis
- Universal Marble & Granite Group
Additional Benefits:
- The market estimate (ME) sheet in Excel format
- 3 months of analyst support
TABLE OF CONTENTS
1 Introduction
- 1.1 Study Assumptions and Market Definition
- 1.2 Scope of the Study
2 Research Methodology
3 Executive Summary
4 Market Landscape
- 4.1 Market Overview
- 4.2 Market Drivers
- 4.2.1 Surging luxury-housing completions in Tier-2 United States metros
- 4.2.2 Tax-rebate programs for historic-building renovations in EU
- 4.2.3 Rapid hotel pipeline expansion across GCC states
- 4.2.4 Rising adoption of large-format gauged stone panels
- 4.2.5 Consumer Preference for Durable and Premium Aesthetic Materials
- 4.2.6 Technological Advancements in Cutting and Finishing Techniques
- 4.3 Market Restraints
- 4.3.1 Volatile import tariffs on Chinese dimensional stone
- 4.3.2 Labor shortages in qualified stone installers
- 4.3.3 Increasing popularity of SPC/LVT alternatives
- 4.3.4 Embodied-carbon regulations restricting natural stone (under-the-radar)
- 4.4 Industry Value Chain Analysis
- 4.5 Porter's Five Forces Analysis
- 4.5.1 Threat of New Entrants
- 4.5.2 Bargaining Power of Suppliers
- 4.5.3 Bargaining Power of Buyers
- 4.5.4 Threat of Substitutes
- 4.5.5 Competitive Rivalry
- 4.6 Insights into the Latest Trends and Innovations in the Market
- 4.7 Insights on Recent Developments (New Product Launches, Strategic Initiatives, Investments, Partnerships, JVs, Expansion, M&As, etc.) in the Market
5 Market Size & Growth Forecasts (Value in USD)
- 5.1 By Product Type
- 5.1.1 Marble
- 5.1.2 Granite
- 5.1.3 Limestone and Travertine
- 5.1.4 Slate
- 5.1.5 Sandstone
- 5.1.6 Engineered/Composite Stone
- 5.2 By End User
- 5.2.1 Residential
- 5.2.2 Commercial
- 5.2.2.1 Hospitality and Leisure
- 5.2.2.2 Retail and Shopping Centers
- 5.2.2.3 Healthcare Facilities
- 5.2.2.4 Education
- 5.2.2.5 Corporate Offices
- 5.2.2.6 Public and Government Buildings
- 5.2.2.7 Other Commercial Users
- 5.3 By Construction Type
- 5.3.1 New Construction
- 5.3.2 Remodeling/Retrofit
- 5.4 By Distribution Channel
- 5.4.1 B2C/Retail Consumers
- 5.4.1.1 Home Centers
- 5.4.1.2 Specialty Flooring Stores
- 5.4.1.3 Online
- 5.4.1.4 Other Distribution Channels
- 5.4.2 B2B/Contractors/Builders
- 5.4.1 B2C/Retail Consumers
- 5.5 By Geography
- 5.5.1 North America
- 5.5.1.1 United States
- 5.5.1.2 Canada
- 5.5.1.3 Mexico
- 5.5.2 South America
- 5.5.2.1 Brazil
- 5.5.2.2 Peru
- 5.5.2.3 Chile
- 5.5.2.4 Argentina
- 5.5.2.5 Rest of South America
- 5.5.3 Europe
- 5.5.3.1 United Kingdom
- 5.5.3.2 Germany
- 5.5.3.3 France
- 5.5.3.4 Spain
- 5.5.3.5 Italy
- 5.5.3.6 BENELUX
- 5.5.3.7 NORDICS
- 5.5.3.8 Rest of Europe
- 5.5.4 Asia-Pacific
- 5.5.4.1 India
- 5.5.4.2 China
- 5.5.4.3 Japan
- 5.5.4.4 Australia
- 5.5.4.5 South Korea
- 5.5.4.6 South East Asia
- 5.5.4.7 Rest of Asia-Pacific
- 5.5.5 Middle East and Africa
- 5.5.5.1 United Arab Emirates
- 5.5.5.2 Saudi Arabia
- 5.5.5.3 South Africa
- 5.5.5.4 Nigeria
- 5.5.5.5 Rest of Middle East and Africa
- 5.5.1 North America
6 Competitive Landscape
- 6.1 Market Concentration
- 6.2 Strategic Moves
- 6.3 Market Share Analysis
- 6.4 Company Profiles (includes Global level Overview, Market level overview, Core Segments, Financials as available, Strategic Information, Market Rank/Share for key companies, Products & Services, and Recent Developments)
- 6.4.1 Antolini Luigi & C. S.p.A.
- 6.4.2 Arizona Tile, LLC
- 6.4.3 Aro Granite Industries Ltd.
- 6.4.4 Bedrosians Tile & Stone
- 6.4.5 Caesarstone Ltd.
- 6.4.6 Cambria Company LLC
- 6.4.7 Cosentino S.A.
- 6.4.8 Dal-Tile Corporation
- 6.4.9 Dimpomar
- 6.4.10 Finstone Group
- 6.4.11 Florim S.p.A.
- 6.4.12 Fox Marble Holdings plc
- 6.4.13 Johnson Tiles
- 6.4.14 Laticrete International, Inc.
- 6.4.15 Levantina y Asociados de Minerales, S.A.
- 6.4.16 Mohawk Industries
- 6.4.17 MSI Surfaces
- 6.4.18 Polycor Inc.
- 6.4.19 Porcelanosa Grupo
- 6.4.20 R.E.D. Graniti S.p.A.
- 6.4.21 Shaw Industries
- 6.4.22 Santucci Group
- 6.4.23 Temmer
- 6.4.24 Topalidis
- 6.4.25 Universal Marble & Granite Group
7 Market Opportunities and Future Outlook
- 7.1 Shift Toward Sustainable and Recycled Stone Materials
- 7.2 Adoption of Advanced Surface Treatments and Finishes

