
PUBLISHER: Mordor Intelligence | PRODUCT CODE: 1934713

PUBLISHER: Mordor Intelligence | PRODUCT CODE: 1934713
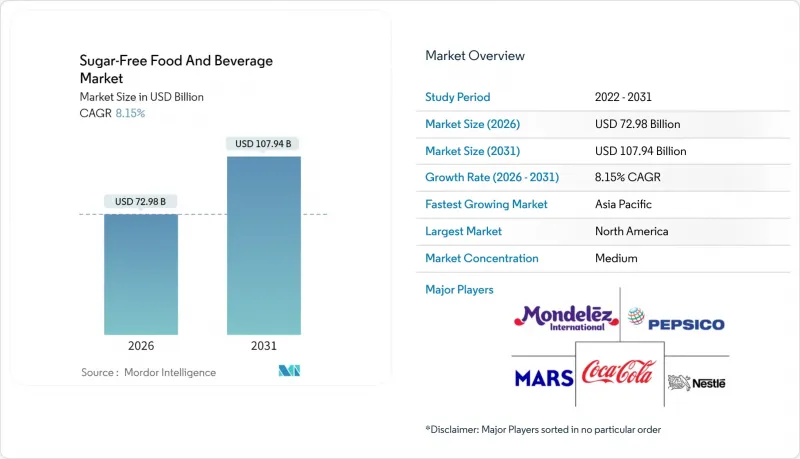
Sugar-Free Food And Beverage - Market Share Analysis, Industry Trends & Statistics, Growth Forecasts (2026 - 2031)
The sugar-free food and beverages market is expected to grow from USD 67.48 billion in 2025 to USD 72.98 billion in 2026 and is forecast to reach USD 107.94 billion by 2031 at 8.15% CAGR over 2026-2031.
Ongoing diabetes escalation, wider adoption of fiscal sugar controls, and continuous ingredient innovation drive this upward trajectory. Beverage reformulations remain vigorous as 54 nations deploy sugar taxes that favor zero-calorie recipes and spur portfolio diversification. Personal nutrition technology, especially continuous glucose monitors linked to diet apps, brings new product personalization pathways. Governments also accelerate approvals for natural high-intensity sweeteners, lowering development risks and attracting fresh capital. Meanwhile, retailers enlarge private-label ranges, leveraging trust and aggressive shelf pricing to expand value creation across every demographic pocket.
Global Sugar-Free Food And Beverage Market Trends and Insights
Diabetes & Obesity Prevalence Fuels Demand
World diabetes cases have quadrupled since 1990 and now exceed 800 million adults, firmly embedding sugar reduction within public health priorities. Population-wide dietary interventions rank high in national action plans as the economic burden of metabolic disorders climbs. In the Asia-Pacific region, forward projections indicate 1.31 billion diabetes cases by 2050, keeping demand for sugar-free alternatives resilient even during economic cycles. Employers and insurers increasingly subsidize low-sugar meals in cafeterias and wellness programs to mitigate productivity losses. Low- and middle-income economies will host nearly 79% of global obesity by 2035, expanding the target consumer base for accessible formulations. This demographic momentum, combined with a structural shift toward preventive care, guarantees enduring demand across all income brackets.
Global Sugar-Tax Legislation Accelerates Reformulations
Sugar-sweetened beverage levies install a clear financial incentive for manufacturers to reformulate existing recipes rather than pay higher tax rates. The U.K. Soft Drinks Industry Levy triggered a 43.7% reduction in average sugar per liter across taxed beverages, while South Africa's Health Promotion Levy drove a 29% fall in fizzy drink purchases. Mexico's decade-old excise tax continues to deliver a 37% volume decline, demonstrating durable public health gains. Yet only seven of 19 MENA economies have adopted similar laws, highlighting untapped legislative white space. As more nations refine levy structures to penalize sugar grams rather than volume alone, reformulation races quicken and multinational firms streamline global ingredient standards to avoid multi-jurisdictional complexity.
Premium Pricing Versus Sugared Counterparts
Sugar-free recipes still command 15-30% shelf premiums because alternative sweeteners need specialized processing lines, smaller batch runs, and stringent compliance protocols. Macroeconomic headwinds, especially currency swings in emerging markets, amplify sticker shocks relative to subsidized conventional products. Price-elastic demographic cohorts hesitate to trial sugar-free options when household budgets tighten, stalling penetration in lower middle-income segments. Manufacturers must either scale volumes or co-invest with retail partners in value packs to soften cost barriers.
Other drivers and restraints analyzed in the detailed report include:
- Continuous Product Innovation in Natural High-Intensity Sweeteners
- Retailer Private-Label Expansion in Sugar-Free SKUs
- Clean-Label Backlash Against Some Artificial Sweeteners
For complete list of drivers and restraints, kindly check the Table Of Contents.
Segment Analysis
Beverages accounted for 38.10% of the sugar-free food and beverages market share in 2025, buoyed by aggressive reformulations triggered by national sugar levies that penalize excess grams rather than total volume. Flagship cola brands extend zero-sugar variants into seasonal flavor drops, sustaining double-digit volume gains that illustrate sustained mass acceptance. Ready-to-drink teas and enhanced waters add incremental shelf presence, leveraging clean-label botanicals and nootropic claims that complement sugar elimination goals. The segment's robust cold-chain infrastructure and established promotional calendars ease nationwide rollouts, tightening incumbent moats. In 2025, beverages added USD 2.6 billion to overall category value, validating a strategic focus on flavor innovations over entirely new sub-categories.
Dietary supplements recorded the highest 7.08% CAGR through 2031, fueled by clinician endorsements that position sugar-free formulations as adjunct tools for glycemic modulation. Functional powders fortified with chromium, zinc, and plant polyphenols accelerate mainstream uptake among gym-goers aiming for metabolic flexibility. Partnerships with CGM manufacturers enable digital bundle offers that align supplement dosage reminders with glucose alerts. Although volumes remain smaller, average unit prices are triple those of beverages, lifting segment profitability. Rapid soft-gel format adaptations further expand addressable demographics, including elderly consumers seeking easy ingestion solutions. Manufacturers collaborate with medical associations to secure endorsement seals, amplifying credibility and shelf pull.
The Sugar-Free Food and Beverages Market Report is Segmented by Product Type (Beverages, Dairy & Dairy Alternatives, Confectionery, and More), Distribution Channel (Supermarkets/Hypermarkets, Convenience & Grocery Stores, Specialty Health and More), and Geography (North America, Europe, APAC, South America, Middle East & Africa). The Market Forecasts are Provided in Terms of Value (USD) and Volume (Units).
Geography Analysis
In 2025, North America led the sugar-free food and beverages market with a 32.05% share, driven by mature regulatory frameworks, widespread product familiarity, and insurance-supported nutrition counseling that promotes sugar avoidance. Retailers distinctly segment artificial and natural sweetener products, enabling targeted promotions for specific consumer groups. Sustainable packaging initiatives by regional suppliers align with eco-conscious consumer values, justifying premium pricing. Additionally, the U.S.-Mexico-Canada Agreement has simplified labeling for zero-sugar claims, streamlining tri-national logistics. Meanwhile, Asia-Pacific recorded the fastest growth with an 8.62% CAGR projected through 2031. Rising urbanization and middle-class incomes are fueling demand for premium sugar-free products, including confectionery and dairy alternatives. Programs like Singapore's Nutri-Grade, which links sugar thresholds to colored labels, are encouraging manufacturers to reformulate products for favorable ratings. China's "Healthy China" plan signals stricter sugar regulations, while localized flavor innovations, such as monk fruit beverages in China and stevia-sweetened yuzu tonics in Japan, enhance cultural relevance and address taste concerns.
Europe maintains steady mid-single-digit growth, supported by EFSA's stringent approval protocols that build consumer trust in sweetener claims. The region's push for front-of-pack traffic-light labeling is steering consumers toward healthier, low-sugar options. In South America, sugar taxation is gaining momentum, with Brazil considering a tiered levy inspired by Mexico's model, which could accelerate reformulations. In the Middle East and Africa, increasing awareness of non-communicable diseases, combined with low taxation coverage, presents an opportunity for policy changes that could boost market value. These regional dynamics collectively highlight the evolving landscape of the global sugar-free food and beverages market.
- The Hershey Company
- Nestle S.A.
- Kellanova
- Mars Incorporated
- PepsiCo Inc.
- The Coca-Cola Company
- The Kraft Heinz Company
- Hostess Brands Inc.
- Mondel?z International Inc.
- Strauss Group Ltd.
- Danone S.A.
- General Mills Inc.
- Abbott Laboratories
- Chobani LLC
- Lakanto (Saraya Co.)
- Unilever plc
- Conagra Brands Inc.
- Tate & Lyle plc
- No Sugar Company Inc.
- Kind LLC
Additional Benefits:
- The market estimate (ME) sheet in Excel format
- 3 months of analyst support
TABLE OF CONTENTS
1 Introduction
- 1.1 Study Assumptions and Market Definition
- 1.2 Scope of the Study
2 Research Methodology
3 Executive Summary
4 Market Landscape
- 4.1 Market Overview
- 4.2 Market Drivers
- 4.2.1 Diabetes & obesity prevalence fuels demand
- 4.2.2 Global sugar-tax legislation accelerates reformulations
- 4.2.3 Continuous product innovation in natural high-intensity sweeteners
- 4.2.4 Retailer private-label expansion in sugar-free SKUs
- 4.2.5 Wearable CGM-driven dietary personalization
- 4.2.6 AI-driven e-commerce merchandising for low-sugar products
- 4.3 Market Restraints
- 4.3.1 Premium pricing versus sugared counterparts
- 4.3.2 Clean-label backlash against some artificial sweeteners
- 4.3.3 Supply volatility of rare plant-based sweeteners
- 4.3.4 Sensory 'flavor fatigue' limiting repeat purchases
- 4.4 Consumer Behavior Analysis
- 4.5 Regulatory Landscape
- 4.6 Technological Outlook
- 4.7 Porter's Five Forces Analysis
- 4.7.1 Bargaining Power of Suppliers
- 4.7.2 Bargaining Power of Buyers / Consumers
- 4.7.3 Threat of New Entrants
- 4.7.4 Threat of Substitute Products
- 4.7.5 Intensity of Competitive Rivalry
5 Market Size and Growth Forecasts (Value and Volume)
- 5.1 By Product Type
- 5.1.1 Beverages
- 5.1.1.1 Carbonated Soft Drinks
- 5.1.1.2 Functional Drinks
- 5.1.1.3 Juices & RTD Tea / Coffee
- 5.1.2 Dairy & Dairy Alternatives
- 5.1.2.1 Milk Drinks
- 5.1.2.2 Yogurt
- 5.1.2.3 Ice Cream
- 5.1.3 Confectionery
- 5.1.3.1 Chocolate
- 5.1.3.2 Gum & Mints
- 5.1.4 Bakery Products
- 5.1.5 Dietary Supplements
- 5.1.6 Savory Snacks
- 5.1.7 Others
- 5.1.1 Beverages
- 5.2 By Distribution Channel
- 5.2.1 Supermarkets / Hypermarkets
- 5.2.2 Convenience & Grocery Stores
- 5.2.3 Specialty Health and Wellness Stores
- 5.2.4 Online Retail
- 5.2.5 Others
- 5.3 By Geography
- 5.3.1 North America
- 5.3.1.1 United States
- 5.3.1.2 Canada
- 5.3.1.3 Mexico
- 5.3.1.4 Rest of North America
- 5.3.2 Europe
- 5.3.2.1 United Kingdom
- 5.3.2.2 Germany
- 5.3.2.3 France
- 5.3.2.4 Italy
- 5.3.2.5 Spain
- 5.3.2.6 Russia
- 5.3.2.7 Rest of Europe
- 5.3.3 Asia-Pacific
- 5.3.3.1 China
- 5.3.3.2 Japan
- 5.3.3.3 India
- 5.3.3.4 Australia
- 5.3.3.5 South-East Asia
- 5.3.3.6 Rest of Asia-Pacific
- 5.3.4 South America
- 5.3.4.1 Brazil
- 5.3.4.2 Argentina
- 5.3.4.3 Rest of South America
- 5.3.5 Middle East & Africa
- 5.3.5.1 Saudi Arabia
- 5.3.5.2 South Africa
- 5.3.5.3 UAE
- 5.3.5.4 Rest of MEA
- 5.3.1 North America
6 Competitive Landscape
- 6.1 Market Concentration
- 6.2 Strategic Moves
- 6.3 Market Share Analysis
- 6.4 Company Profiles (includes Global level Overview, Market level overview, Core Segments, Financials as available, Strategic Information, Market Rank/Share for key companies, Products & Services, and Recent Developments)
- 6.4.1 The Hershey Company
- 6.4.2 Nestle S.A.
- 6.4.3 Kellanova
- 6.4.4 Mars Incorporated
- 6.4.5 PepsiCo Inc.
- 6.4.6 The Coca-Cola Company
- 6.4.7 The Kraft Heinz Company
- 6.4.8 Hostess Brands Inc.
- 6.4.9 Mondel?z International Inc.
- 6.4.10 Strauss Group Ltd.
- 6.4.11 Danone S.A.
- 6.4.12 General Mills Inc.
- 6.4.13 Abbott Laboratories
- 6.4.14 Chobani LLC
- 6.4.15 Lakanto (Saraya Co.)
- 6.4.16 Unilever plc
- 6.4.17 Conagra Brands Inc.
- 6.4.18 Tate & Lyle plc
- 6.4.19 No Sugar Company Inc.
- 6.4.20 Kind LLC
7 Market Opportunities & Future Outlook

