
PUBLISHER: Mordor Intelligence | PRODUCT CODE: 1934769

PUBLISHER: Mordor Intelligence | PRODUCT CODE: 1934769
Europe ETF - Market Share Analysis, Industry Trends & Statistics, Growth Forecasts (2026 - 2031)
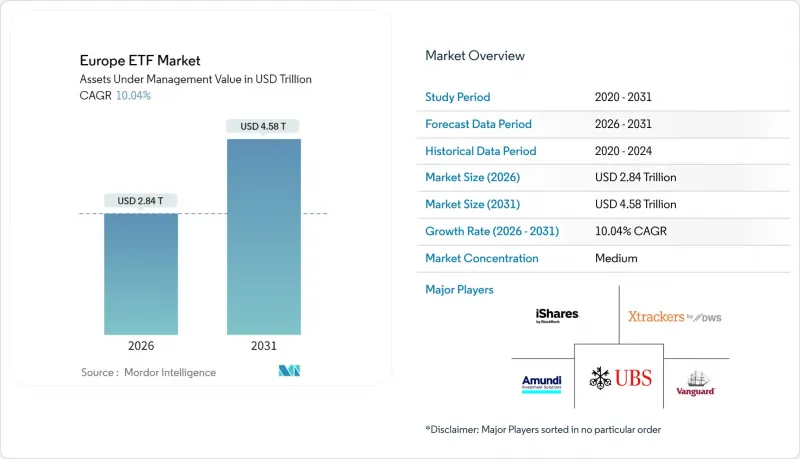
The Europe ETF market was valued at USD 2.58 trillion in 2025 and estimated to grow from USD 2.84 trillion in 2026 to reach USD 4.58 trillion by 2031, at a CAGR of 10.04% during the forecast period (2026-2031).
Growth is propelled by MiFID II fee-transparency pressure, regulatory incentives for low-cost vehicles, and rapid digitization of distribution. Product innovation in active, thematic, and ESG strategies is broadening the appeal of exchange-traded funds, while the planned transition to T+1 settlement is expected to improve post-trade efficiency once operational hurdles are resolved. Intensifying competition among global and regional asset managers continues to compress fees, yet it also accelerates product breadth, especially in fixed-income and alternatives. Taken together, these factors confirm the structural realignment of European portfolios toward exchange-traded formats and suggest further penetration into both institutional mandates and retail savings plans.
Europe ETF Market Trends and Insights
Shift from Mutual Funds to Low-Cost Passive Vehicles amid MiFID II Fee Transparency
MiFID II's granular disclosure rules have forced wealth managers to justify every basis point charged, prompting a pronounced asset shift into ETFs. Advisory firms are redesigning model portfolios around low-cost core allocations, thereby normalizing ETFs as primary building blocks across discretionary mandates. The new pricing clarity also triggered a decline in research coverage for small- and mid-cap issuers, which in turn amplified demand for broadly diversified equity ETFs that require no single-stock analysis. In 2024, European ETF net inflows set a record, confirming that fee transparency is permanently changing investor behavior. These dynamics collectively anchor a durable preference for passive wrappers within the Europe ETF market.
Proliferation of ESG Regulations, such as SFDR Level 2, Boosting Flows into Sustainable ETFs
SFDR Level 2 has created a rule-based taxonomy that channels capital toward well-defined sustainability objectives. Managers now segment Article 8 and Article 9 line-ups with clear impact metrics, allowing investors to express environmental or social priorities inside cost-efficient vehicles. Anticipated SFDR 2.0 revisions introduce additional product classes-Sustainable, Transition, ESG Collection, and Unclassified-further sharpening disclosures and accentuating Europe's first-mover advantage in responsible investing. As allocators recalibrate toward net-zero alignment, sustainable ETFs enjoy stronger organic growth and often command slightly higher fees, counterbalancing industry-wide margin compression. Consequently, ESG regulation is a structural growth catalyst for the Europe ETF market.
Fragmented European Exchange Landscape Elevating Trading & Settlement Costs
Twenty-nine trading venues and heterogeneous clearing houses impede consolidated liquidity and inflate bid-ask spreads. More than half of the 11,000-plus ETF listings trade fewer than 10 times daily, forcing market makers to warehouse risk, particularly during volatile sessions. The forthcoming move to T+1 settlement aims to harmonize with United States timing, but creates interim operational complexity given the EU's current T+2 norm. Industry responses include Euronext's plan to centralize settlement across Amsterdam, Brussels, and Paris, yet full benefits hinge on multilateral adoption. Until harmonization materializes, structural fragmentation remains a drag on the velocity of flows within the Europe ETF market.
Other drivers and restraints analyzed in the detailed report include:
- Increased Adoption of ETFs in Pension Schemes Post PEPP Framework
- Growth of Digital Brokerage Platforms Enabling Commission-Free ETF Savings Plans
- UCITS Concentration Caps Limiting Thematic ETF Launches
For complete list of drivers and restraints, kindly check the Table Of Contents.
Segment Analysis
Equity ETFs accounted for a 67.12% share of the Europe ETF market in 2025, confirming their status as the core allocation vehicle across portfolios. Bond demand is picking up as the ECB pivots toward looser monetary conditions, and defensive investor sentiment is channeling fresh flows into short-duration government and investment-grade corporate ETFs. Commodities remain primarily tactical instruments, yet gold-linked funds saw solid inflows during early 2025 risk-off episodes, underscoring their role as volatility buffers. Real estate and currency exposures persist as minority allocations, chiefly for hedging or yield-enhancement use cases. Structural tailwinds-fee compression, transparency, and secondary-market liquidity-keep equity in pole position even as other asset classes gain relevance.
Alternatives post the fastest trajectory, expanding at a 13.54% CAGR through 2031 as defined-outcome, derivative-income, and buffer products scale. The WisdomTree Europe Defense ETF launch shows how geopolitical funding shifts translate into new exposures, while option-based strategies offer downside mitigation that resonates with cautious retail savers. Fixed-income wrappers have also transformed price discovery in historically opaque bond markets, allowing institutional desks to execute portfolio-level adjustments intraday. Blended multi-asset ETFs are emerging, packaging equity, bond, and commodity sleeves under a single umbrella, further broadening appeal. These advances underscore how innovation continues to diversify the Europe ETF market.
Passive products captured 90.02% of the Europe ETF market in 2025, yet active ETFs are projected to expand at a 14.88% CAGR, signaling the early phase of a structural rebalance. Luxembourg's removal of subscription tax for active listings and Ireland's authorization of semi-transparent structures reduce two longstanding operational barriers. Asset managers view active wrappers as convenient channels to distribute proven mutual-fund IP in a lower-cost, exchange-traded format. Fee differentials remain meaningful-active products generally price 15-20 bps higher-yet investors accept the premium when strategies exhibit alpha consistency. As more managers replicate core mutual fund franchises in ETF form, incremental inflows will carve a larger slice of the Europe ETF market.
Passive leadership nevertheless persists, supported by scale economies in manufacturing and seeding, plus tight expense ratios that can fall below eight basis points on flagship index trackers. Record inflows into core benchmarks during the 2024-2025 period attest to cost sensitivity across both retail and institutional segments. Smart-beta methodologies occupy a middle ground, blending systematic tilts with transparent rule sets, and continue to draw interest from asset allocators seeking factor exposure without full active-manager risk. Traditional market-capitalization products therefore remain the foundational building blocks inside model portfolios across the Europe ETF market.
The Europe ETF Market is Segmented by Asset Class (Equity ETFs, Fixed-Income ETFs, Commodity ETFs, and More), by Investment Strategy (Active and Passive), by Investor Type (Retail and Institutional), by Distribution Channel (Direct and Digital Retail Platforms, Financial Advisors and Wealth Managers, and More), and by Country (United Kingdom, Germany, and More). The Market Forecasts are Provided in Terms of Value (USD).
List of Companies Covered in this Report:
- BlackRock - iShares
- Amundi (incl. Lyxor)
- DWS - Xtrackers
- UBS Asset Management
- Vanguard
- Invesco
- WisdomTree
- HSBC Asset Management
- State Street
- Legal & General (L&G)
- Franklin Templeton
- BNP Paribas Easy
- Goldman Sachs Asset Management
- Natixis Ossiam
- First Trust
- HANetf
- VanEck
- Raiffeisen Capital Management
- Kempen Capital
- Fidelity International
Additional Benefits:
- The market estimate (ME) sheet in Excel format
- 3 months of analyst support
TABLE OF CONTENTS
1 Introduction
- 1.1 Study Assumptions & Market Definition
- 1.2 Scope of the Study
2 Research Methodology
3 Executive Summary
4 Market Landscape
- 4.1 Market Overview
- 4.2 Market Drivers
- 4.2.1 Shift from Mutual Funds to Low-Cost Passive Vehicles Amid MiFID II Fee Transparency
- 4.2.2 Proliferation of ESG Regulations, such as SFDR Level 2, Boosting Flows into Sustainable ETFs
- 4.2.3 Increased Adoption of ETFs in Pension Schemes Post PEPP Framework
- 4.2.4 Growth of Digital Brokerage Platforms Enabling Commission-Free ETF Savings Plans
- 4.2.5 Expansion of Fixed-Income ETFs After ECB Policy Changes
- 4.2.6 Cross-Border Tax Harmonization via EU Withholding-Tax Relief Pilot Enhancing Liquidity
- 4.3 Market Restraints
- 4.3.1 Fragmented European Exchange Landscape Elevating Trading & Settlement Costs
- 4.3.2 UCITS Concentration Caps Limiting Thematic ETF Launches
- 4.3.3 Regulatory Scrutiny on Synthetic Replication Counterparty Risk
- 4.3.4 Liquidity Concerns During Stress Episodes (e.g., 2022 LDI Crisis)
- 4.4 Value / Supply-Chain Analysis
- 4.5 Regulatory Outlook
- 4.6 Technological Outlook
- 4.7 Porter's Five Forces
- 4.7.1 Bargaining Power of Buyers
- 4.7.2 Bargaining Power of Suppliers
- 4.7.3 Threat of New Entrants
- 4.7.4 Threat of Substitutes
- 4.7.5 Intensity of Competitive Rivalry
5 Market Size & Growth Forecasts (Value)
- 5.1 By Asset Class
- 5.1.1 Equity ETFs
- 5.1.2 Fixed-Income ETFs
- 5.1.3 Commodity ETFs
- 5.1.4 Currency ETFs
- 5.1.5 Real-Estate ETFs
- 5.1.6 Alternative ETFs
- 5.2 By Investment Strategy
- 5.2.1 Active
- 5.2.2 Passive
- 5.3 By Investor Type
- 5.3.1 Retail
- 5.3.2 Institutional
- 5.4 By Distribution Channel
- 5.4.1 Direct and Digital Retail Platforms
- 5.4.2 Financial Advisors and Wealth Managers
- 5.4.3 Institutional Channels
- 5.4.4 Traditional Banks and Full-Service Brokers
- 5.5 By Country
- 5.5.1 United Kingdom
- 5.5.2 Germany
- 5.5.3 France
- 5.5.4 Spain
- 5.5.5 Italy
- 5.5.6 Benelux (Belgium, Netherlands, and Luxembourg)
- 5.5.7 Nordics (Sweden, Norway, Denmark, Finland, and Iceland)
- 5.5.8 Rest of Europe
6 Competitive Landscape
- 6.1 Market Concentration
- 6.2 Strategic Moves
- 6.3 Market Share Analysis
- 6.4 Company Profiles (includes Global Level Overview, Market Level Overview, Core Segments, Financials as available, Strategic Information, Market Rank/Share for Key Companies, Products & Services, and Recent Developments)
- 6.4.1 BlackRock - iShares
- 6.4.2 Amundi (incl. Lyxor)
- 6.4.3 DWS - Xtrackers
- 6.4.4 UBS Asset Management
- 6.4.5 Vanguard
- 6.4.6 Invesco
- 6.4.7 WisdomTree
- 6.4.8 HSBC Asset Management
- 6.4.9 State Street
- 6.4.10 Legal & General (L&G)
- 6.4.11 Franklin Templeton
- 6.4.12 BNP Paribas Easy
- 6.4.13 Goldman Sachs Asset Management
- 6.4.14 Natixis Ossiam
- 6.4.15 First Trust
- 6.4.16 HANetf
- 6.4.17 VanEck
- 6.4.18 Raiffeisen Capital Management
- 6.4.19 Kempen Capital
- 6.4.20 Fidelity International
7 Market Opportunities & Future Outlook
- 7.1 White-Space & Unmet-Need Assessment

