
PUBLISHER: Mordor Intelligence | PRODUCT CODE: 1934800

PUBLISHER: Mordor Intelligence | PRODUCT CODE: 1934800
Dental 3D Printing - Market Share Analysis, Industry Trends & Statistics, Growth Forecasts (2026 - 2031)
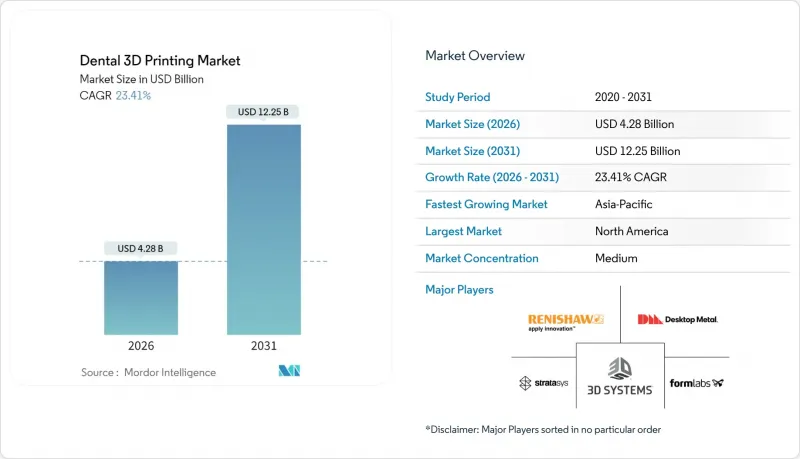
Dental 3D Printing market size in 2026 is estimated at USD 4.28 billion, growing from 2025 value of USD 3.47 billion with 2031 projections showing USD 12.25 billion, growing at 23.41% CAGR over 2026-2031.
Rapid regulatory clearances for direct-printed orthodontic devices, AI-driven design automation, and Asia-Pacific digitization programs are accelerating the shift from subtractive techniques to additive processes that cut material waste by as much as 90% [WILEY.COM]. Leading manufacturers are rolling out high-speed printers that trim production costs for large-volume laboratories, while validated biocompatible resins give clinicians confidence to broaden chairside use. Healthcare payers in Japan and China are already reimbursing CAD/CAM restorations, signaling a policy tailwind that other regions are expected to follow. At the same time, supply-chain pressure on photoinitiator chemicals and looming emission limits for acrylate resins highlight the need for greener chemistries and local sourcing strategies.
Global Dental 3D Printing Market Trends and Insights
Cost & Workflow Advantages of Chairside 3-D Printing
Studies show that digital workflows cut direct treatment costs by 18% and slash laboratory labor expenses by 49%. Same-day delivery removes repeat visits, and simultaneous printing of eight or more restorations drives economies of scale for high-volume clinics. Digital denture fabrication now costs USD 5.95 per unit compared with USD 43.18 for milled alternatives, while saving 154 chairside minutes per patient. These economics resonate with cost-conscious practices seeking faster turnaround and higher patient satisfaction. The appeal grows as resin yields rise and printer prices fall, widening access beyond early adopters within the dental 3D printing market.
Increasing Incidence of Dental Caries & Edentulism
An aging global population underpins sustained demand for crowns, bridges and dentures. Edentulism rates among adults over 65 continue to climb, prompting healthcare systems to prioritize efficient restorative care that additive technologies can deliver. Japan illustrates the challenge: a record number of dental clinics closed in 2024 due to workforce shortages, forcing remaining practices to digitize for productivity. Similar demographic pressure is emerging in China and Western Europe. 3D printing offers a scalable pathway to meet the surge, delivering custom prosthetics that improve fit while lowering rework rates.
High Capital & Material Cost of Dental 3-D Printers
Professional printers still range from USD 4,499 for entry models to much higher five-figure price tags for production systems. Resin and metal powder costs add recurring expense in clinics where procedure volume is unpredictable. A cross-sectional survey of German practices ranked investment cost as the top adoption barrier, especially for single-chair surgeries. Leasing programs and pay-per-part services are easing the burden, yet the sticker shock persists in Latin America and parts of Southeast Asia.
Other drivers and restraints analyzed in the detailed report include:
- Rising Demand for Cosmetic Dentistry & Aesthetic Restorations
- AI-Driven CAD Automating Sub-30-Minute Crown Workflows
- Limited Reimbursement for 3-D-Printed Prosthetics
For complete list of drivers and restraints, kindly check the Table Of Contents.
Segment Analysis
Vat photopolymerization accounted for 45.18% of the dental 3D printing market revenue in 2025, underscoring its precision and broad resin palette in the dental 3D printing market. Selective laser sintering's 24.68% CAGR reflects growing demand for metal frameworks and implant components, a trend that pushes printer makers to refine powder-bed temperatures for cobalt-chrome and titanium.
R&D into visible-light photoinitiators is raising cure speed while lowering toxic emissions, helping vat systems comply with looming ISO standards. Meanwhile, PolyJet and digital light processing platforms carve out niches for multi-material guides and full-color models. As validated material libraries expand, buyers are future-proofing with open-architecture printers to tap cross-technology flexibility in the dental 3D printing market.
Equipment generated 39.94% of the dental 3D printing market revenue in 2025, reflecting sustained capital expenditures by laboratories building fleets of printers and scanners. However, the services segment is climbing at a 25.72% CAGR as clinics outsource the design and production of complex appliances to specialized hubs.
This service momentum mirrors trends in other healthcare verticals where central fabrication can drive down unit cost. Resin and metal powder suppliers are partnering with print farms to validate workflows, adding a recurring revenue layer that stabilizes cash flow. As a result, service bureaus are forecast to eclipse equipment sales by volume in the dental 3D printing market during the next decade.
The Dental 3D Printing Market Report is Segmented by Technology (Vat Photopolymerization, Polyjet, and More), Product & Service (Materials, Equipment, Services), Application (Prosthodontics, Orthodontics, Implantology), End-User (Dental Laboratories, Hospitals & Clinics, Others), and Geography (North America, Europe, Asia-Pacific, Middle East and Africa, South America). The Market Forecasts are Provided in Terms of Value (USD).
Geography Analysis
North America contributed 38.72% of 2025 revenue, supported by early FDA pathways and insurance coverage for CAD/CAM crowns. The region's 22.45% CAGR to 2031 is healthy but slower than emerging markets because most high-income consumers already have access to digital dentistry. Private equity groups are reshaping laboratory networks through roll-ups that seek economies of scale across multistate operations.
Asia-Pacific is the fastest-growing region at 25.11% CAGR, propelled by China's advanced-manufacturing strategy and insurance reforms that speed NMPA approvals. Japan's elderly demographic and coverage for chairside restorations sustain steady procedure volume, while India's digital health mission and dental tourism add incremental demand. The region's diverse purchasing power calls for flexible price tiers, encouraging local printer assembly to avoid import duties and smooth currency volatility in the dental 3D printing market.
Europe posts a 22.96% CAGR as public-sector clinics in Germany, France and the Nordic countries adopt 3D printing for cost-controlled prosthodontics. Meanwhile, the Middle East & Africa and South America are expanding at 24.58% and 24.21% CAGR, respectively, driven by medical-tourism corridors and private healthcare investments. Governments are beginning to sponsor training programs that position domestic technicians to serve regional demand.
List of Companies Covered in this Report:
- 3D Systems Corp.
- Ackuretta Technologies
- Asiga
- Carbon Inc.
- Dentsply Sirona
- Desktop Metal (EnvisionTEC)
- DMG Digital Enterprises
- Formlabs Inc.
- GE Additive
- Straumann Group
- Kulzer
- Materialise
- Nexa3D
- Quoris3D
- Rapid Shape
- Renishaw plc
- Shining 3D
- SprintRay
- Stratasys
- Zortrax SA
Additional Benefits:
- The market estimate (ME) sheet in Excel format
- 3 months of analyst support
TABLE OF CONTENTS
1 Introduction
- 1.1 Study Assumptions & Market Definition
- 1.2 Scope of the Study
2 Research Methodology
3 Executive Summary
4 Market Landscape
- 4.1 Market Overview
- 4.2 Market Drivers
- 4.2.1 Cost & Workflow Advantages of Chairside 3-D Printing
- 4.2.2 Rapid Adoption of Direct-Printed Clear Aligners Post-2025 FDA Nod
- 4.2.3 Increasing Incidence of Dental Caries & Edentulism
- 4.2.4 Growing Availability of Validated Biocompatible Resins & Metals
- 4.2.5 Rising Demand for Cosmetic Dentistry & Aesthetic Restorations
- 4.2.6 AI-Driven CAD Automating Sub-30-Minute Crown Workflows
- 4.3 Market Restraints
- 4.3.1 High Capital & Material Cost of Dental 3-D Printers
- 4.3.2 Limited Reimbursement for 3-D-Printed Prosthetics
- 4.3.3 Imminent ISO/FDA Curbs on Photopolymer Emissions
- 4.3.4 Supply-Chain Vulnerability of APAC Photoinitiator Makers
- 4.4 Supply Chain Analysis
- 4.5 Regulatory Landscape
- 4.6 Technological Outlook
- 4.7 Porter's Five Forces Analysis
- 4.7.1 Threat of New Entrants
- 4.7.2 Bargaining Power of Buyers
- 4.7.3 Bargaining Power of Suppliers
- 4.7.4 Threat of Substitutes
- 4.7.5 Intensity of Competitive Rivalry
5 Market Size & Growth Forecasts (Value)
- 5.1 By Technology
- 5.1.1 Vat Photopolymerization
- 5.1.2 PolyJet
- 5.1.3 Fused Deposition Modelling
- 5.1.4 Selective Laser Sintering
- 5.1.5 Other Technologies
- 5.2 By Product & Service
- 5.2.1 Materials
- 5.2.1.1 Plastics
- 5.2.1.2 Metals
- 5.2.1.3 Others
- 5.2.2 Equipment
- 5.2.2.1 Dental 3-D Scanners
- 5.2.2.2 Dental 3-D Printers
- 5.2.3 Services
- 5.2.1 Materials
- 5.3 By Application
- 5.3.1 Prosthodontics
- 5.3.2 Orthodontics
- 5.3.3 Implantology
- 5.4 By End-User
- 5.4.1 Dental Laboratories
- 5.4.2 Hospitals & Clinics
- 5.4.3 Others
- 5.5 By Geography
- 5.5.1 North America
- 5.5.1.1 United States
- 5.5.1.2 Canada
- 5.5.1.3 Mexico
- 5.5.2 Europe
- 5.5.2.1 Germany
- 5.5.2.2 United Kingdom
- 5.5.2.3 France
- 5.5.2.4 Italy
- 5.5.2.5 Spain
- 5.5.2.6 Rest of Europe
- 5.5.3 Asia-Pacific
- 5.5.3.1 China
- 5.5.3.2 Japan
- 5.5.3.3 India
- 5.5.3.4 Australia
- 5.5.3.5 South Korea
- 5.5.3.6 Rest of Asia-Pacific
- 5.5.4 Middle East and Africa
- 5.5.4.1 GCC
- 5.5.4.2 South Africa
- 5.5.4.3 Rest of Middle East and Africa
- 5.5.5 South America
- 5.5.5.1 Brazil
- 5.5.5.2 Argentina
- 5.5.5.3 Rest of South America
- 5.5.1 North America
6 Competitive Landscape
- 6.1 Market Concentration
- 6.2 Competitive Benchmarking
- 6.3 Market Share Analysis
- 6.4 Company Profiles (includes Global level Overview, Market level overview, Core Segments, Financials as available, Strategic Information, Market Rank/Share for key companies, Products & Services, and Recent Developments)
- 6.4.1 3D Systems Corp.
- 6.4.2 Ackuretta Technologies
- 6.4.3 Asiga
- 6.4.4 Carbon Inc.
- 6.4.5 Dentsply Sirona Inc.
- 6.4.6 Desktop Metal (EnvisionTEC)
- 6.4.7 DMG Digital Enterprises
- 6.4.8 Formlabs Inc.
- 6.4.9 GE Additive
- 6.4.10 Institut Straumann AG
- 6.4.11 Kulzer GmbH
- 6.4.12 Materialise NV
- 6.4.13 Nexa3D
- 6.4.14 Quoris3D
- 6.4.15 Rapid Shape GmbH
- 6.4.16 Renishaw plc
- 6.4.17 Shining 3D
- 6.4.18 SprintRay Inc.
- 6.4.19 Stratasys Ltd.
- 6.4.20 Zortrax SA
7 Market Opportunities & Future Outlook
- 7.1 White-space & Unmet-Need Assessment

