
PUBLISHER: Mordor Intelligence | PRODUCT CODE: 1934827

PUBLISHER: Mordor Intelligence | PRODUCT CODE: 1934827
United States Telecom Towers - Market Share Analysis, Industry Trends & Statistics, Growth Forecasts (2026 - 2031)
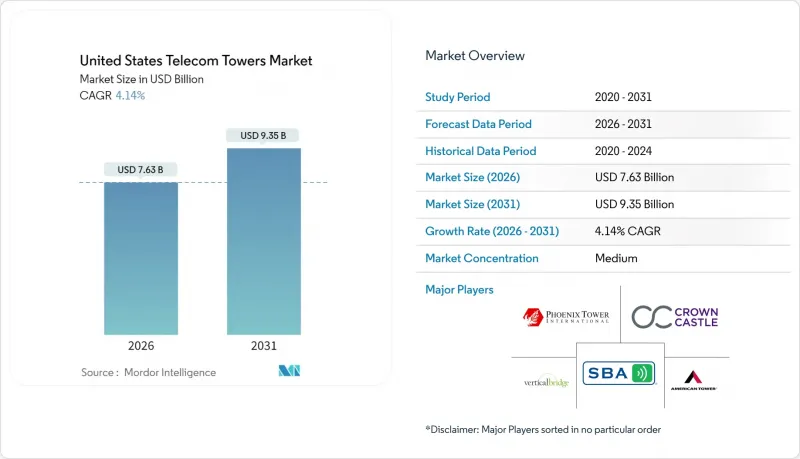
United States Telecom Towers Market size in 2026 is estimated at USD 7.63 billion, growing from 2025 value of USD 7.33 billion with 2031 projections showing USD 9.35 billion, growing at 4.14% CAGR over 2026-2031.
Long-term growth hinges on densifying mid-band and C-band 5G rather than erecting large volumes of new structures, so operators are extracting more revenue from existing assets through advanced antenna systems and multi-tenant lease-up. Independent tower companies have scaled fastest, helped by carrier asset divestitures that recycle capital into spectrum. Energy modernization, particularly solar-hybrid power, is another structural tailwind as fuel cost volatility and environmental rules accelerate renewable deployments. Simultaneously, favorable federal tax incentives and defense-funded Open-RAN pilots keep capital flowing into modernization projects even as borrowing rates stay elevated.
United States Telecom Towers Market Trends and Insights
5G Mid-Band and C-Band Densification Wave
Carriers are channeling roughly USD 35 billion of 2025 capex into 3.5 GHz and C-band upgrades that bolt additional antennas, radios, and power systems onto existing structures rather than funding green-field builds. This shift allows tower companies with proven modification expertise to command higher amendment rents and quicker tenant additions. T-Mobile's rapid deployment of ex-Sprint mid-band spectrum exemplifies how densification generates fresh revenue streams across thousands of co-located sites. The emphasis on site upgrades keeps the United States telecom towers market growing, even where new construction is zoning-constrained. Engineering complexity also raises switching barriers for carriers, reinforcing long leases and predictable cash flows for leading tower REITs.
IRS "Safe-Harbor" Bonus Depreciation
Accelerated depreciation lets tower owners expense a large share of upgrade costs in year one, boosting after-tax returns and freeing cash for additional projects. Independent operators pass part of this benefit to carrier tenants through competitive rent escalators, thereby strengthening their value proposition versus self-owned towers. Qualifying assets extend beyond steel and concrete to fiber backhaul, batteries, and environmental hardening, making the incentive relevant across multiple upgrade waves. The policy particularly supports rural sites where revenue per tenant is lower, yet modernization costs remain fixed, sustaining nationwide momentum for the United States telecom towers market.
Municipal Height Caps (<150 ft)
Many suburban councils now cap structure height at 150 ft, lengthening permitting cycles and raising design complexity . Operators must adopt costlier stealth poles or add rooftop small cells, often doubling site counts for equivalent coverage. Approval timelines can exceed 24 months, deferring cash flows and tempering the growth trajectory of the United States telecom towers market.
Other drivers and restraints analyzed in the detailed report include:
- DoD Open-RAN Pilot Funding
- Fiber-to-Tower tax credits in CHIPS and Science Act
- High Cost of Capital
For complete list of drivers and restraints, kindly check the Table Of Contents.
Segment Analysis
Independent tower companies dominated the United States telecom towers market with a 75.02% share in 2025 and are on track for a 4.66% CAGR through 2031. Carrier divestitures free up funds for spectrum auctions, so Verizon's USD 3.3 billion sale of 6,339 sites to Vertical Bridge capped a multi-year shift to asset-light strategies. Multiple tenants per structure lift returns, and scale synergies in maintenance, energy, and permitting create structural cost advantages.
Operator-owned sites remain strategically important where mission-critical coverage demands direct control, yet their relative growth lags. Joint-venture vehicles emerge for rural or military builds where carriers retain influence while leveraging independent expertise.
Ground-based structures accounted for 74.15% of 2025 revenue within the United States telecom towers market; rooftops, however, carry a 5.24% CAGR outlook to 2031. Dense downtown corridors often prohibit new macro towers, so property-owner agreements enable quicker rooftop deployments that fill millimeter-wave coverage gaps.
Ground sites still drive the highest average tenancy, Crown Castle reports 2.4 tenants per tower, so they remain core revenue engines . Yet zoning pushback and aesthetics tilt incremental demand toward concealed facades, canister poles, and parapet-mounted small cells. These urban installations carry shorter development cycles, supporting faster revenue realization even if per-site rent is lower.
The United States Telecom Towers Market Report is Segmented by Ownership (Operator-Owned, Independent TowerCo, and More), Installation (Rooftop, Ground-Based), Fuel Type (Renewable-Powered, Grid/Diesel Hybrid), and Tower Type (Monopole, Lattice, Guyed, Stealth/Concealed). The Market Forecasts are Provided in Terms of Value (USD) and Volume (Installed Base).
List of Companies Covered in this Report:
- TowerCos
- Mobile Network Operator
Additional Benefits:
- The market estimate (ME) sheet in Excel format
- 3 months of analyst support
TABLE OF CONTENTS
1 INTRODUCTION
- 1.1 Study Assumptions and Market Definition
- 1.2 Scope of the Study
- 1.3 Taxonomy
2 RESEARCH METHODOLOGY
3 EXECUTIVE SUMMARY
- 3.1 Telecom Tower Volume Estimates (Units, 2023-2030)
- 3.2 Telecom Tower Leasing Revenue Estimates (USD, 2023-2030)
- 3.3 Telecom Tower Construction Revenue Estimates (USD, 2023-2030)
4 MARKET LANDSCAPE
- 4.1 Market Overview
- 4.2 Market Drivers
- 4.2.1 5G mid-band and C-band densification wave
- 4.2.2 IRS "safe-harbor" bonus depreciation on tower upgrades
- 4.2.3 DoD Open-RAN pilot funding across military bases
- 4.2.4 T-Mobile and Crown Castle 12-yr master-lease renewal
- 4.2.5 Fiber-to-Tower tax credits in CHIPS and Science Act
- 4.2.6 State-level net-metering for solar-hybrid power
- 4.3 Market Restraints
- 4.3.1 Municipal height caps (<150 ft)
- 4.3.2 High cost of capital (Fed Funds >4.75 %)
- 4.3.3 Cable-MVNO CBRS small-cell off-load
- 4.3.4 Diesel-genset refueling moratoria (post-2028)
- 4.4 Ecosystem Analysis
- 4.5 Regulatory Landscape Related to Telecom Infrastructure
- 4.6 Technological Outlook
- 4.7 Porter's Five Forces Analysis
- 4.7.1 Bargaining Power of Suppliers
- 4.7.2 Bargaining Power of Buyers
- 4.7.3 Threat of New Entrants
- 4.7.4 Threat of Substitutes
- 4.7.5 Intensity of Competitive Rivalry
- 4.8 Impact of Macroeconomic Factors on the Market
5 MARKET SIZE AND GROWTH FORECASTS (VALUE AND VOLUME, 2023-2030)
- 5.1 By Ownership
- 5.1.1 Operator-owned
- 5.1.2 Independent TowerCo
- 5.1.3 Joint-Venture TowerCo
- 5.1.4 MNO Captive
- 5.2 By Installation
- 5.2.1 Rooftop
- 5.2.2 Ground-based
- 5.3 By Fuel Type
- 5.3.1 Renewable-powered
- 5.3.2 Grid/Diesel Hybrid
- 5.4 By Tower Type
- 5.4.1 Monopole
- 5.4.2 Lattice
- 5.4.3 Guyed
- 5.4.4 Stealth / Concealed
6 COMPETITIVE LANDSCAPE
- 6.1 Market Concentration
- 6.2 Details of Major Mergers and Acquisitions
- 6.3 Market Share Analysis for Top Vendors
- 6.4 Company Profiles (includes Global level Overview, Market level overview, Core Segments, Financials, Strategic Information,Products and Services, Recent Developments)
- 6.4.1 TowerCos
- 6.4.1.1 American Tower Corporation
- 6.4.1.2 Crown Castle Inc.
- 6.4.1.3 SBA Communications Corp.
- 6.4.1.4 Vertical Bridge, REIT, LLC
- 6.4.1.5 Phoenix Tower International (PTI)
- 6.4.2 Mobile Network Operator
- 6.4.2.1 Verizon Communications Inc.
- 6.4.2.2 AT&T Inc.
- 6.4.2.3 T-Mobile US, Inc.
- 6.4.2.4 Dish Wireless (DISH Network L.L.C)
- 6.4.1 TowerCos
7 MARKET OPPORTUNITIES AND FUTURE OUTLOOK
- 7.1 White-space and Unmet-need Assessment
- 7.2 Investment Analysis
- 7.3 Analyst Suggestions and Recommendations

