
PUBLISHER: Mordor Intelligence | PRODUCT CODE: 1934839

PUBLISHER: Mordor Intelligence | PRODUCT CODE: 1934839
United States Active Pharmaceutical Ingredients (API) - Market Share Analysis, Industry Trends & Statistics, Growth Forecasts (2026 - 2031)
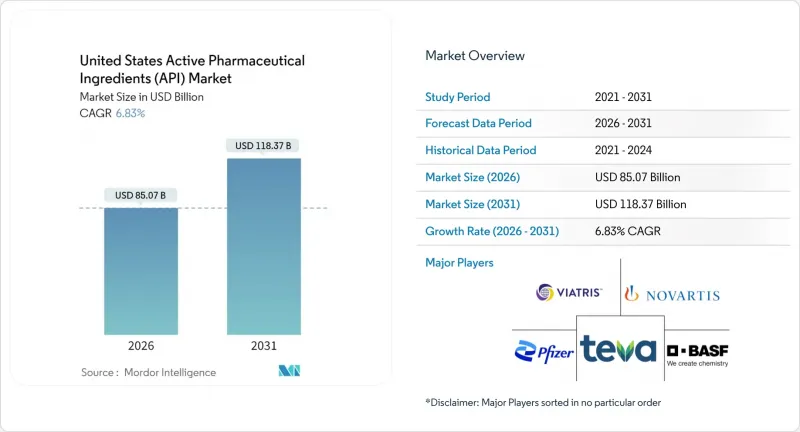
United States Active Pharmaceutical Ingredients market size in 2026 is estimated at USD 85.07 billion, growing from 2025 value of USD 79.63 billion with 2031 projections showing USD 118.37 billion, growing at 6.83% CAGR over 2026-2031.
Supply-chain fragilities exposed by COVID-19 and escalating geopolitical risk have prompted more than USD 160 billion in pledged Big Pharma manufacturing investments since 2020. mRNA breakthroughs and a broader biologics pipeline are intensifying demand for complex large-molecule ingredients, while oncology's pivot toward high-potency compounds reallocates capital toward specialized containment facilities. Continuous manufacturing and AI-enabled quality systems are shortening cycle times and mitigating Medicare price pressures through productivity gains. Strategic clustering in North Carolina, Indiana, and Michigan compresses lead times by colocating skilled labor, regulators, and logistics nodes.
United States Active Pharmaceutical Ingredients (API) Market Trends and Insights
Diversifying U.S. Supply-Chain Incentives for Domestic API Manufacturing
A USD 34 billion federal program, coupled with Eli Lilly's USD 27 billion factory build-out, has reset the cost calculus for on-shore API production. Incentives such as tax credits and accelerated depreciation shrink China's historical 35-40% cost edge. The API Innovation Center is tasked with reshoring 25% of small-molecule supply within five years under a USD 14 million grant.
Surge in Advanced Biologics & mRNA Therapy Pipelines
Biologics CDMOs are expanding 9-11% a year, outpacing small-molecule growth because personalized medicine needs sophisticated fermentation and lipid-system capabilities. Fujifilm's USD 1.2 billion North Carolina upgrade adds 160,000 L of bioreactor capacity. Croda secured USD 75 million in government backing to expand U.S. lipid production for mRNA therapies. AI-assisted workflows are boosting biologics throughput by 20%.
Price Erosion from Medicare Drug Price Negotiations
Initial CMS talks slashed prices by 22-80% for ten high-volume drugs, stripping USD 6 billion from annual sales in a single round. The 2025 list broadens to 15 products, four of them oncology agents, setting a precedent for across-the-board cost resets that ripple directly to upstream API suppliers. Because negotiations group all indications sharing an active ingredient, manufacturers must peg API costs to the lowest-margin use case, squeezing profitability unless they pivot toward biosimilars and generics exempt from the rules.
Other drivers and restraints analyzed in the detailed report include:
- Federal Funding for Pandemic-Preparedness Stockpiles
- Growing Demand for High-Potency APIs from the Oncology Boom
- Shortage of Skilled Process Chemists & Engineers
For complete list of drivers and restraints, kindly check the Table Of Contents.
Segment Analysis
Merchant providers captured 64.58% of the United States Active Pharmaceutical Ingredients market in 2025, and their 7.05% CAGR through 2031 far outpaces captive operations. CDMOs are evolving into CRDMOs that knit discovery, CMC, and commercial supply into one workflow, trimming development timelines by 50%. Virtual pharmaceutical firms without bricks-and-mortar plants represent the fastest-growing client block, driving small-volume, high-complexity orders that favor merchant flexibility. Continuous-manufacturing expertise lets these providers swing between batches in hours instead of days, a capability captive units rarely match.
Strategic alliances reinforce merchant leadership: Recipharm's pact with Exela opens a North Carolina sterile line able to run 100 million units annually. Merchant plants also gain FDA fast-track benefits for innovative equipment, shortening validation cycles. Several Big Pharma companies are spinning surplus reactors into merchant subsidiaries, boosting asset utilization while preserving quality oversight. Heightened due-diligence standards after past contamination events create a reputational moat favoring established CDMOs. As Medicare negotiations lower margins on commoditized drugs, innovators lean on merchants to squeeze out 5-10% extra efficiency that captive networks often cannot unlock.
Synthetic chemistry still delivered 70.88% of 2025 revenue, yet biotech APIs are climbing at 7.12% CAGR as personalized medicine scales. Viral-vector, mRNA, and recombinant-protein workloads demand stainless-steel and single-use bioreactors, driving capex per cubic meter far above small-molecule norms. Firms that once specialized in solvent-based synthesis now pursue hybrid footprints through M&A or joint ventures.
Continuous bioprocessing lets hybrid plants exploit real-time analytics common to flow-chemistry lines, smoothing the learning curve. Upstream convergence shows in PAT sensors that monitor both cell viability and solvent purity, reducing training hours for operators. Still, each 200,000 L mammalian suite costs roughly USD 800 million, so first movers enjoy scale economics that late entrants struggle to replicate. Regulatory harmonization between synthetic and biologic modules remains incomplete, forcing dual audit tracks that raise compliance spend by 12-15% but also slow copy-cat capacity abroad.
The United States Active Pharmaceutical Ingredients (API) Market is Segmented by Business Mode (Captive API and Merchant API), Synthesis Type (Synthetic and Biotech), Drug Type (Generic and Branded), and Application (Cardiology, Oncology, Pulmonology, Neurology, Orthopedic, Ophthalmology, and Other Applications). The Report Offers the Value (in USD Billion) for the Above Segments.
List of Companies Covered in this Report:
- Pfizer
- Merck
- Viatris
- Teva Pharmaceutical Industries
- BASF
- Cambrex
- Catalent
- Thermo Fisher Scientific (Patheon)
- Johnson & Johnson
- Amgen
- Bristol-Myers Squibb
- Gilead Sciences
- Abbvie
- Eli Lilly and Company
- Novartis Pharmaceuticals Corp.
- Sun Pharmaceutical Industries Inc. (Taro)
- Dr. Reddy's Laboratories Inc.
- Lupin
- Lonza Group
- Aurobindo Pharma
Additional Benefits:
- The market estimate (ME) sheet in Excel format
- 3 months of analyst support
TABLE OF CONTENTS
1 Introduction
- 1.1 Study Assumptions & Market Definition
- 1.2 Scope of the Study
2 Research Methodology
3 Executive Summary
4 Market Landscape
- 4.1 Market Overview
- 4.2 Market Drivers
- 4.2.1 Diversifying U.S. supply-chain incentives for domestic API manufacturing
- 4.2.2 Surge in advanced biologics & mRNA therapy pipelines
- 4.2.3 Federal funding for pandemic-preparedness stockpiles
- 4.2.4 Growing demand for high-potency APIs (HPAPIs) from oncology boom
- 4.2.5 Adoption of continuous manufacturing technologies
- 4.2.6 Contract development & manufacturing outsourcing surge among virtual pharma
- 4.3 Market Restraints
- 4.3.1 Price erosion from Medicare Drug Price Negotiations
- 4.3.2 Environmental compliance costs for U.S. API plants
- 4.3.3 Shortage of skilled process chemists & engineers
- 4.3.4 Rising competition from Indian & Chinese low-cost producers
- 4.4 Value / Supply-Chain Analysis
- 4.5 Regulatory Landscape
- 4.6 Technological Outlook
- 4.7 Porter's Five Forces
- 4.7.1 Threat of New Entrants
- 4.7.2 Bargaining Power of Buyers/Consumers
- 4.7.3 Bargaining Power of Suppliers
- 4.7.4 Threat of Substitute Products
- 4.7.5 Intensity of Competitive Rivalry
5 Market Size & Growth Forecasts (Value - USD)
- 5.1 By Business Mode
- 5.1.1 Captive API
- 5.1.2 Merchant API
- 5.2 By Synthesis Type
- 5.2.1 Synthetic
- 5.2.2 Biotech
- 5.3 By Molecule Size
- 5.3.1 Small-Molecule
- 5.3.2 Large-Molecule / Biologics
- 5.4 By Potency
- 5.4.1 High-Potency APIs (HPAPI)
- 5.4.2 Low/Medium-Potency APIs
- 5.5 By Application
- 5.5.1 Cardiology
- 5.5.2 Pulmonology
- 5.5.3 Oncology
- 5.5.4 Ophthalmology
- 5.5.5 Neurology
- 5.5.6 Orthopedic
- 5.5.7 Other Applications
- 5.6 By End-User
- 5.6.1 Domestic Pharma Manufacturers
- 5.6.2 Multinational Pharma Subsidiaries (KSA)
- 5.6.3 CDMOs / CMOs
- 5.6.4 Hospitals & Research Institutes
6 Competitive Landscape
- 6.1 Market Concentration
- 6.2 Strategic Moves
- 6.3 Market Share Analysis
- 6.4 Company Profiles (includes Global level Overview, Market level overview, Core Segments, Financials as available, Strategic Information, Market Rank/Share for key companies, Products & Services, and Recent Developments)
- 6.4.1 Pfizer Inc.
- 6.4.2 Merck & Co., Inc.
- 6.4.3 Viatris Inc.
- 6.4.4 Teva Pharmaceutical Industries Ltd.
- 6.4.5 BASF Corporation
- 6.4.6 Cambrex Corporation
- 6.4.7 Catalent, Inc.
- 6.4.8 Thermo Fisher Scientific (Patheon)
- 6.4.9 Johnson & Johnson
- 6.4.10 Amgen Inc.
- 6.4.11 Bristol-Myers Squibb Company
- 6.4.12 Gilead Sciences, Inc.
- 6.4.13 AbbVie Inc.
- 6.4.14 Eli Lilly and Company
- 6.4.15 Novartis Pharmaceuticals Corp.
- 6.4.16 Sun Pharmaceutical Industries Inc. (Taro)
- 6.4.17 Dr. Reddy's Laboratories Inc.
- 6.4.18 Lupin Pharmaceuticals, Inc.
- 6.4.19 Lonza Group
- 6.4.20 Aurobindo Pharma USA
7 Market Opportunities & Future Outlook
- 7.1 White-space & Unmet-Need Assessment

