
PUBLISHER: Mordor Intelligence | PRODUCT CODE: 1934855

PUBLISHER: Mordor Intelligence | PRODUCT CODE: 1934855
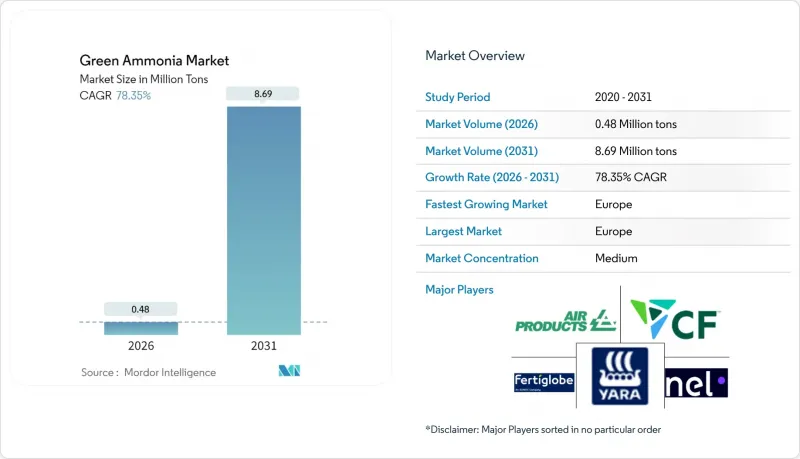
Green Ammonia - Market Share Analysis, Industry Trends & Statistics, Growth Forecasts (2026 - 2031)
Green Ammonia market size in 2026 is estimated at 0.48 million tons, growing from 2025 value of 0.27 million tons with 2031 projections showing 8.69 million tons, growing at 78.35% CAGR over 2026-2031.
Intensifying policy support in Europe, Japan and India, falling renewable electricity costs toward USD 0.02 per kWh in resource-rich regions, and the dual utility of green ammonia as fertilizer and carbon-free fuel collectively accelerate adoption. Maritime decarbonization mandates, particularly the European Union's inclusion of shipping in its Emissions Trading System from 2024, create early demand for ammonia-powered vessels, while hydrogen strategies in Germany, Japan and South Korea position green ammonia as a key hydrogen carrier. At the project level, integrated plants that combine renewable generation, large-scale electrolysis and ammonia synthesis are unlocking economies of scale. Meanwhile, competition from blue ammonia continues, yet the green ammonia market benefits from independence from natural-gas volatility and the prospect of future carbon-pricing premiums.
Global Green Ammonia Market Trends and Insights
Increasing Fertilizer Demand from Food-Insecure Nations
Developing economies are prioritizing domestic production of green ammonia to reduce fertilizer import dependence and strengthen food security. The Russia-Ukraine conflict exposed vulnerabilities in conventional fertilizer trade, prompting Kenya, Nigeria, and similar nations to announce gigawatt-scale renewable-to-ammonia projects to stabilize supply chains. The African Union's 2063 neutrality goals foster public-private ventures that link wind and solar resources to smallholder cooperatives. Multilateral lenders have allocated USD 2.3 billion to sustainable fertilizer programs, channeling concessional finance into electrolysis capacity. Countries with high solar and wind potential can achieve delivered costs that undercut imported gray ammonia, shifting the competitive balance. As food-import bills rise, agricultural ministries increasingly bundle fertilizer policy with energy-independence targets, accelerating offtake agreements that underpin financial close for new plants. This momentum contributes strongly to green ammonia market expansion across Africa and South Asia.
Decarbonization Policies Accelerating Green Fuels in Shipping
The International Maritime Organization's target to halve emissions by 2050 and the EU carbon-pricing extension are catalyzing ammonia fuel adoption. Maersk, NYK Line, and other carriers have placed orders for ammonia-ready vessels, planning commercial operation before 2030. Japan's Ministry of Economy, Trade and Industry co-funds ammonia engines and mandates 20% ammonia co-firing in power plants, creating overlapping fuel demand. Interim IMO guidelines issued in 2025 clarify safety protocols, triggering investment in bunkering hubs at Rotterdam and Singapore. Port authorities that integrate bunkering infrastructure with renewable-hydrogen backhaul capture early-mover advantages, reinforcing regional clusters.
High Capital Requirements for Electrolysis and Haber-Bosch Retrofits
Electrolyzer packages account for up to half of the total installed cost, at USD 800-1,200 per kW for alkaline units. A 1 million-ton-per-year green ammonia complex demands 500-1,000 MW of electrolyzers, translating to USD 400-1,200 million before adding Haber-Bosch synthesis and renewable generation assets. Continuous ammonia output requires firm renewable power or battery buffer systems, adding 10-15% to capital expenditure. Project finance hinges on 15-25-year power-purchase and offtake contracts-structures still uncommon in emerging markets. Despite incentives like the US Inflation Reduction Act and Europe's Innovation Fund, higher technology risk premiums are significantly increasing the levelized costs. This rise is causing delays in final investment decisions, highlighting a significant challenge for the green ammonia market.
Other drivers and restraints analyzed in the detailed report include:
- Growing Demand for Green Ammonia as a Hydrogen Carrier
- Increasing Procurement of Green and Low-Carbon Fertilizers
- Safety and Toxicity Hurdles for Maritime Bunkering
For complete list of drivers and restraints, kindly check the Table Of Contents.
Segment Analysis
Agriculture commanded 87.25% of the green ammonia market share in 2025, and the segment is expanding at an 84.1% CAGR through 2031. The statistic underscores the continued primacy of fertilizer demand even as new energy applications emerge. Food-insecure regions seek energy-independent nutrient solutions, and bundled subsidy schemes shorten payback periods on local production assets.
Marine fuel holds a modest baseline today, yet confirmed shipbuilding orders and bunkering terminal announcements indicate an inflection by 2028. Power generation trials in Japan, co-firing up to 20% ammonia in thermal plants, illustrate crossover demand that raises plant load factors and cuts per-unit costs. The hydrogen-carrier segment, backed by import strategies in Germany and South Korea, offers long-haul linkage between renewable hot-spots and industrial consumption centers. Chemical feedstock and steel decarbonization add niche but premium-valued outlets, broadening the revenue mix and cushioning the green ammonia industry against commodity-cycle volatility.
The Green Ammonia Market Report is Segmented by Application (Agriculture, Marine Fuel, Power Generation, Hydrogen Carrier, Other Applications), and Geography (Asia-Pacific, North America, Europe, South America, Middle East and Africa). The Market Forecasts are Provided in Terms of Volume (tons).
Geography Analysis
Europe's leadership, with a 35.35% green ammonia market share in 2025 and an 84.9% CAGR, rests on comprehensive policy alignment that internalizes carbon prices and rewards renewable content. Norway's SkiGA offshore-wind-to-ammonia project will supply 100,000 tons per year, setting a regional benchmark for integrated value chains. Germany's dedicated import terminal at Rotterdam complements domestic electrolysis build-out, ensuring redundancy in supply for industrial users.
Asia-Pacific plays a significant role as a regional contributor. Japan targets 30 million tons of ammonia demand by 2050, combining maritime and power-station offtake, while China pilots multi-GW renewable ammonia plants under provincial stimulus packages. South Korea's public-private coalition aligns 13 firms and five institutes around production and import logistics, and India's 550,000-ton annual subsidy scheme catalyzes megaprojects such as AM Green's 1 million-ton complex in Andhra Pradesh. These initiatives collectively underpin strong regional growth, with Asia-Pacific facilities positioned both for domestic uptake and exports. North America benefits from the Inflation Reduction Act's production tax credits, evidenced by CF Industries' Louisiana joint venture targeting 1.4 million tons annual capacity. The Middle East and Africa are emerging as export-oriented hubs; the UAE secured the first H2Global pilot shipment to Germany, validating long-distance trade economics. Brazil's Ceara state aggregates several projects leveraging onshore wind and port proximity, broadening South America's stake in the global green ammonia market. Across these continents, comparative advantage hinges on renewable resource endowment, policy incentives and shipping distances to demand centers, factors that will shape future investment allocation.
- ACME Group
- Air Products and Chemicals Inc.
- AM Green
- Casale SA
- CF Industries Holdings Inc.
- Engie SA
- ENOWA
- Fertiglobe
- Fortescue
- Greenko Group
- Iberdrola, S.A.
- ITM Power plc
- KAPSOM plc
- MAN Energy Solutions
- Nel
- Ocior
- Orsted AS
- Proton Ventures
- Siemens Energy
- Technip Energies N.V.
- thyssenkrupp Uhde GmbH
- Yara
Additional Benefits:
- The market estimate (ME) sheet in Excel format
- 3 months of analyst support
TABLE OF CONTENTS
1 Introduction
- 1.1 Study Assumptions and Market Definition
- 1.2 Scope of the Study
2 Research Methodology
3 Executive Summary
4 Market Landscape
- 4.1 Market Overview
- 4.2 Market Drivers
- 4.2.1 Increasing fertilizer demand from food-insecure nations
- 4.2.2 Decarbonization policies accelerating green fuels in shipping
- 4.2.3 Growing demand for green ammonia as a hydrogen carrier
- 4.2.4 Increasing procurement of green and low-carbon fertilizers
- 4.2.5 Increasing usage in power generation and grid stability
- 4.3 Market Restraints
- 4.3.1 High capital requirements for electrolysis and Haber-Bosch retrofits
- 4.3.2 Safety and toxicity hurdles for maritime bunkering
- 4.3.3 Blue-ammonia cost competition where gas and carbon capture storage (CCS) are cheap
- 4.4 Value Chain Analysis
- 4.5 Porter's Five Forces
- 4.5.1 Bargaining Power of Suppliers
- 4.5.2 Bargaining Power of Buyers
- 4.5.3 Threat of New Entrants
- 4.5.4 Threat of Substitutes
- 4.5.5 Degree of Competition
5 Market Size and Growth Forecasts (Volume)
- 5.1 By Application
- 5.1.1 Agriculture
- 5.1.2 Marine Fuel
- 5.1.3 Power Generation
- 5.1.4 Hydrogen Carrier
- 5.1.5 Other Applications (Industrial Feedstock, etc.)
- 5.2 By Geography
- 5.2.1 Asia-Pacific
- 5.2.1.1 China
- 5.2.1.2 Japan
- 5.2.1.3 India
- 5.2.1.4 South Korea
- 5.2.1.5 ASEAN Countries
- 5.2.1.6 Rest of Asia-Pacific
- 5.2.2 North America
- 5.2.2.1 United States
- 5.2.2.2 Canada
- 5.2.2.3 Mexico
- 5.2.3 Europe
- 5.2.3.1 Germany
- 5.2.3.2 United Kingdom
- 5.2.3.3 France
- 5.2.3.4 Italy
- 5.2.3.5 Spain
- 5.2.3.6 Russia
- 5.2.3.7 NORDIC Countries
- 5.2.3.8 Rest of Europe
- 5.2.4 South America
- 5.2.4.1 Brazil
- 5.2.4.2 Argentina
- 5.2.4.3 Rest of South America
- 5.2.5 Middle East and Africa
- 5.2.5.1 Saudi Arabia
- 5.2.5.2 South Africa
- 5.2.5.3 Rest of Middle East and Africa
- 5.2.1 Asia-Pacific
6 Competitive Landscape
- 6.1 Market Concentration
- 6.2 Strategic Moves
- 6.3 Market Share(%)/Ranking Analysis
- 6.4 Company Profiles (includes Global level Overview, Market level overview, Core Segments, Financials as available, Strategic Information, Market Rank/Share for key companies, Products & Services, and Recent Developments)
- 6.4.1 ACME Group
- 6.4.2 Air Products and Chemicals Inc.
- 6.4.3 AM Green
- 6.4.4 Casale SA
- 6.4.5 CF Industries Holdings Inc.
- 6.4.6 Engie SA
- 6.4.7 ENOWA
- 6.4.8 Fertiglobe
- 6.4.9 Fortescue
- 6.4.10 Greenko Group
- 6.4.11 Iberdrola, S.A.
- 6.4.12 ITM Power plc
- 6.4.13 KAPSOM plc
- 6.4.14 MAN Energy Solutions
- 6.4.15 Nel
- 6.4.16 Ocior
- 6.4.17 Orsted AS
- 6.4.18 Proton Ventures
- 6.4.19 Siemens Energy
- 6.4.20 Technip Energies N.V.
- 6.4.21 thyssenkrupp Uhde GmbH
- 6.4.22 Yara
7 Market Opportunities and Future Outlook
- 7.1 White-space and Unmet-need Assessment
- 7.2 Growing research on affordable production of green ammonia

