
PUBLISHER: Mordor Intelligence | PRODUCT CODE: 1934863

PUBLISHER: Mordor Intelligence | PRODUCT CODE: 1934863
Asia-Pacific Amusement Park - Market Share Analysis, Industry Trends & Statistics, Growth Forecasts (2026 - 2031)
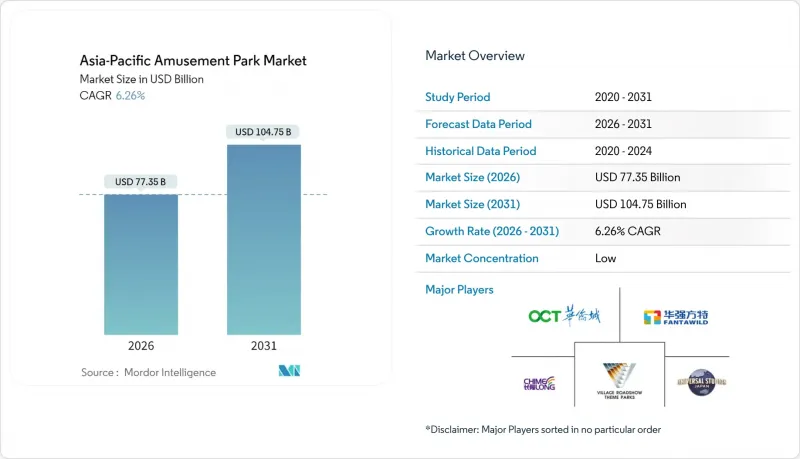
The Asia-Pacific Amusement Park Market was valued at USD 72.79 billion in 2025 and estimated to grow from USD 77.35 billion in 2026 to reach USD 104.75 billion by 2031, at a CAGR of 6.26% during the forecast period (2026-2031).
Solid demand stems from rapid urbanization, middle-class income gains, and government-backed tourism corridors that add new visitor catchments at a steady clip. Operators are pivoting toward integrated resorts that keep visitors on-site for several days, converting attendance volume into higher per-capita spending through bundled hospitality, dining, and retail. Digital queue systems and variable pricing engines are raising capacity utilization while smoothing seasonal traffic spikes, a capability that maximizes asset yield without large capital outlays. Licensing agreements with global entertainment franchises have shifted competitive advantage toward content exclusivity, prompting smaller local chains to seek collaborative IP or region-specific storytelling to remain relevant. Sustainability credentials have become a prerequisite for construction permits, pushing operators to embed renewable power, recycled water systems, and habitat conservation programs into master plans. Capital intensity and an eight-to-twelve-year payback horizon continue to discourage speculative entrants, yet the market's fragmentation leaves room for experienced foreign brands that can align with national tourism objectives and de-risk financing through public-private partnerships.
Asia-Pacific Amusement Park Market Trends and Insights
Rising Disposable Incomes Spur Premium-Priced Experiences
Household purchasing power has reached thresholds that allow discretionary leisure spending to outpace GDP growth across the region, and each 1% uplift in disposable income is feeding 1.5-2% jumps in theme-park receipts. Chinese consumers surpassed 400 million middle-income earners in 2025, a cohort that gravitated toward high-margin add-ons such as bundled hotel packages and gourmet dining. Hengqin Chimelong Resort exemplifies the pivot: premium packages combining marine shows, five-star lodging, and curated retail outsold base admission by double-digit margins in the latest season. Comparable patterns appear in India's tier-1 metros, where young professionals now book annual passes bundled with resort stays rather than day tickets. Operators are therefore reallocating capex from pure ride throughput toward experience zones that command premium pricing without increasing footprint. Dynamic pricing engines ensure peak-day rates move in sync with willingness to pay, lifting yield even when visitation growth moderates. As long as wage expansion holds, premiumization will remain the primary lever for top-line acceleration across the Asia-Pacific amusement park market.
Urbanization Creates Integrated Resort Clusters
APAC governments continue underwriting infrastructure bridges, rail spurs, and airports that places new population hubs within two-hour door-to-gate radii of major parks. The Greater Bay Area's transit network has already connected Shenzhen, Macau, and Zhuhai, pushing same-day visitor pools upward by tens of millions. Equivalent connectivity projects around Jakarta and Ho Chi Minh City are written into national masterplans, with funding tied to entertainment-anchored mixed-use zones. Large land tracts earmarked for amusement parks now include adjacent retail, residential, and convention centers, creating diversified cash flows that cushion off-season volatility. Municipalities favor operators who commit to local supply-chain sourcing and workforce development, translating urbanization dividends into reduced entitlement risk. While build-times stretch beyond four years, first movers lock in prime parcels and tax incentives that later entrants seldom match, securing strategic depth in the Asia-Pacific amusement park market.
Capital Intensity Limits New Entrants
World-class integrated resorts now demand budgets exceeding USD 500 million, including transit connectors and utility infrastructure. Cost inflation in steel, logistics, and theming materials adds further pressure, with contractors quoting double-digit increases versus pre-pandemic baselines. Financing structures typically blend state land grants, syndicated bank debt, and minority equity from strategic partners, yet debt-service schedules remain vulnerable to macro shocks. In emerging economies, currency swings can widen interest burdens overnight, elongating breakeven. Consequently, greenfield projects increasingly cluster around government-backed special economic zones that offer guarantees, a prerequisite many mid-tier operators cannot secure. The capital hurdle therefore suppresses competitive churn, cementing incumbency in the Asia-Pacific amusement park market.
Other drivers and restraints analyzed in the detailed report include:
- Government Incentives Accelerate Foreign IP Rollouts
- IP-Based Attractions Cement Competitive Moats
- ESG Alignment Accelerates Permitting and Community Support
- Seasonality Undermines Revenue Stability
For complete list of drivers and restraints, kindly check the Table Of Contents.
Segment Analysis
Mechanical attractions captured 48.20% of 2025 revenue, underscoring their foundational role in the Asia-Pacific amusement park market size. Classic coasters, drop towers, and spinning rides remain crowd magnets, especially in family-centric parks across China and Australia where reliability and broad appeal are prized. Operators are nonetheless focusing spending on thematic refreshes LED lighting, synchronized audio, and on-ride video rather than new steel layouts, stretching asset life while refreshing guest perception. Water rides, holding 31.30% share, thrive in tropical climates where year-round operations deliver superior payback compared with seasonal North-Asian peers. The category is also diversifying into surf pools and hybrid flumes that merge action sports with narrative storytelling, a fusion that widens demographic reach.
The fastest-growing segment belongs to other rides integrating AR/VR, which are forecast to clip along at 11.35% CAGR through 2031. These installations typically occupy smaller footprints and allow software refresh cycles that keep content current without costly hardware swaps. Pop Mart's city-park AR overlays prove the model by driving repeat visitation for episodic content drops tied to cinematic releases. Revenue upside extends beyond ticketing; digital collectible sales and season-pass upgrades spin incremental margin with negligible variable cost. As headset prices decline and 5G latency improves, AR/VR penetration is poised to move from novelty to mainstream across the Asia-Pacific amusement park market.
The Asia-Pacific Amusement Park Market Report is Segmented by Rides (Mechanical Rides, Water Rides, Other Rides), Age (Up To 18 Years, 19 To 35 Years, 36 To 50 Years, 51 To 65 Years, More Than 65 Years), Revenue Source (Tickets, Food & Beverages, Merchandise, Hotels/Resorts, Others), and Geography (India, China, Japan, Australia, South Korea, Southeast Asia). The Market Forecasts are Provided in Terms of Value (USD).
List of Companies Covered in this Report:
- Chimelong Group
- OCT Enterprise Co.
- Fantawild Holdings
- Universal Studios Japan (USJ LLC)
- Village Roadshow Theme Parks
- Merlin Entertainments (Legoland Malaysia)
- Hong Kong Disneyland
- Genting Malaysia (Resorts World)
- Everland (Samsung C&T)
- Lotte World
- Ocean Park Corporation
- Sunway Lagoon
- Adlabs Imagicaa
- Ramoji Film City
- Worlds of Wonder (Appu Ghar)
- Fuji-Q Highland
- Trans Studio (Indonesia)
- Enchanted Kingdom
- Dreamworld (Ardent Leisure)
- Warner Bros. Movie World
- Shanghai Disney Resort (Disney)
Additional Benefits:
- The market estimate (ME) sheet in Excel format
- 3 months of analyst support
TABLE OF CONTENTS
1 Introduction
- 1.1 Study Assumptions & Market Definition
- 1.2 Scope of the Study
2 Research Methodology
3 Executive Summary
4 Market Landscape
- 4.1 Market Overview
- 4.2 Market Drivers
- 4.2.1 Rising disposable incomes of APAC middle class
- 4.2.2 Rapid urbanization & mega-project developments
- 4.2.3 Government tourism-promotion incentives
- 4.2.4 Expansion of IP-based branded attractions
- 4.2.5 Virtual-queue & dynamic-pricing tech boosts yields
- 4.2.6 ESG-aligned renewable utilities speeding approvals
- 4.3 Market Restraints
- 4.3.1 High capex & long ROI cycles
- 4.3.2 Seasonality-driven attendance volatility
- 4.3.3 Cyber-security risks in ticketing & wristband tech
- 4.3.4 Aging ride infrastructure & safety incidents
- 4.4 Value / Supply-Chain Analysis
- 4.5 Regulatory Landscape
- 4.6 Technological Outlook
- 4.7 Porter's Five Forces
- 4.7.1 Threat of New Entrants
- 4.7.2 Bargaining Power of Suppliers
- 4.7.3 Bargaining Power of Buyers
- 4.7.4 Threat of Substitutes
- 4.7.5 Industry Rivalry
5 Market Size & Growth Forecasts
- 5.1 By Rides
- 5.1.1 Mechanical Rides
- 5.1.2 Water Rides
- 5.1.3 Other Rides
- 5.2 By Age
- 5.2.1 Upto 18 years
- 5.2.2 19 to 35 years
- 5.2.3 36 to 50 years
- 5.2.4 51 to 65 years
- 5.2.5 More than 65 years
- 5.3 By Revenue Source
- 5.3.1 Tickets
- 5.3.2 Food & Beverages
- 5.3.3 Merchandise
- 5.3.4 Hotels/Resorts
- 5.3.5 Others
- 5.4 By Country
- 5.4.1 India
- 5.4.2 China
- 5.4.3 Japan
- 5.4.4 Australia
- 5.4.5 South Korea
- 5.4.6 South-East Asia
- 5.4.6.1 Singapore
- 5.4.6.2 Malaysia
- 5.4.6.3 Thailand
- 5.4.6.4 Indonesia
- 5.4.6.5 Vietnam
- 5.4.6.6 Philippines
- 5.5 Rest of Asia-Pacific
6 Competitive Landscape
- 6.1 Market Concentration
- 6.2 Strategic Moves
- 6.3 Market Share Analysis
- 6.4 Company Profiles {(includes Global level Overview, Market level overview, Core Segments, Financials as available, Strategic Information, Market Rank/Share for key companies, Products & Services, and Recent Developments)}
- 6.4.1 Chimelong Group
- 6.4.2 OCT Enterprise Co.
- 6.4.3 Fantawild Holdings
- 6.4.4 Universal Studios Japan (USJ LLC)
- 6.4.5 Village Roadshow Theme Parks
- 6.4.6 Merlin Entertainments (Legoland Malaysia)
- 6.4.7 Hong Kong Disneyland
- 6.4.8 Genting Malaysia (Resorts World)
- 6.4.9 Everland (Samsung C&T)
- 6.4.10 Lotte World
- 6.4.11 Ocean Park Corporation
- 6.4.12 Sunway Lagoon
- 6.4.13 Adlabs Imagicaa
- 6.4.14 Ramoji Film City
- 6.4.15 Worlds of Wonder (Appu Ghar)
- 6.4.16 Fuji-Q Highland
- 6.4.17 Trans Studio (Indonesia)
- 6.4.18 Enchanted Kingdom
- 6.4.19 Dreamworld (Ardent Leisure)
- 6.4.20 Warner Bros. Movie World
- 6.4.21 Shanghai Disney Resort (Disney)
7 Market Opportunities & Future Outlook
- 7.1 Immersive mixed-reality dark-ride clusters for mid-tier parks
- 7.2 Senior-wellness & rehabilitation themed micro-parks

