
PUBLISHER: Mordor Intelligence | PRODUCT CODE: 1934883

PUBLISHER: Mordor Intelligence | PRODUCT CODE: 1934883
Zinc - Market Share Analysis, Industry Trends & Statistics, Growth Forecasts (2026 - 2031)
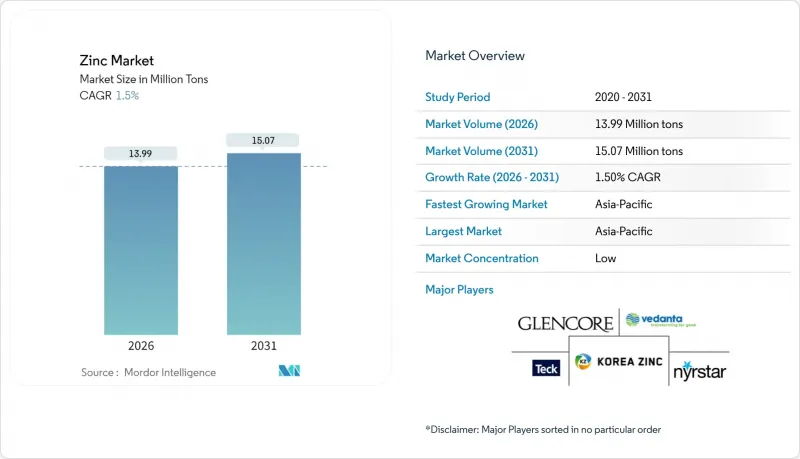
Zinc market size in 2026 is estimated at 13.99 Million tons, growing from 2025 value of 13.78 Million tons with 2031 projections showing 15.07 Million tons, growing at 1.5% CAGR over 2026-2031.
Infrastructure renewal across Asia-Pacific, breakthroughs in zinc-based batteries and rising use of zinc-fortified fertilizers are reshaping consumption patterns, offsetting slower growth in traditional galvanizing. Producers are balancing primary mining with secondary recovery to meet stricter ESG rules, while technology upgrades in smelting aim to curb emissions and improve margins. Supply surpluses have kept prices volatile, yet long-duration energy storage and agricultural biofortification point to fresh outlets that could tighten balances later in the decade. Competitive dynamics favor integrated players with both mine ownership and recycling capacity, positioning them to capture premium opportunities in sustainable applications.
Global Zinc Market Trends and Insights
Infrastructure-Led Galvanizing Demand Surge
Record infrastructure spending programs across emerging economies are translating directly into higher coated-steel offtake, lifting zinc demand even as residential real estate cools in China. Each USD 1 trillion allocated to roads, rail and power grids generates roughly 0.3 kg of zinc per dollar through galvanizing. Government green-infrastructure mandates add momentum because solar arrays and offshore wind towers rely on thick zinc coatings that ensure multi-decade corrosion protection. As a result, infrastructure accounts for more than half of projected incremental zinc demand to 2030, underpinning pricing during periods of mine-concentrate tightness and encouraging smelters to adopt low-carbon roasting and leaching technologies to secure environmental approvals.
Growth of Corrosion-Resistant Steel in EV and Renewables
Electric-vehicle makers and wind-turbine fabricators are shifting from conventional galvanizing toward zinc-aluminum-magnesium coatings that deliver longer service life at thinner coating weights, lifting the metal's value per kilogram even when volumes grow slowly. Premium EV platforms now specify zinc-rich layers for under-body components and battery housings to mitigate corrosion risk in high-voltage environments. Offshore wind structures intensify the pull because tower sections and transition pieces need coatings that withstand brine spray for more than 25 years, making zinc demand per megawatt roughly 40% higher than in fossil-fuel plants. As EV production tops 20 million units in 2025, each incremental point of market penetration embeds an additional 15-20 kilotons of zinc in the vehicle fleet. The premium commanded by specialized coatings supports smelter margins and encourages alloy makers to expand production capacity near automotive clusters.
Stringent Environmental and ESG Regulations
Air-emission limits and carbon-footprint disclosures are inflating compliance costs, particularly for smelters in Europe and North America where particulate thresholds now sit at 50 mg/dscm under updated U.S. EPA standards. The European Critical Raw Materials Act adds recycling quotas and due-diligence audits that favor operators able to certify low-carbon supply chains. Compliance spending raises operating costs by 5-8% but also filters out marginal, high-emission capacity, effectively tightening refined supply. Early adopters such as Hindustan Zinc monetize their advantage through branded low-carbon slabs that secure premiums in automotive tenders. Over the medium term, ESG stringency will reshape trade patterns as importers institute border-carbon mechanisms, compelling producers in all regions to accelerate decarbonization efforts.
Other drivers and restraints analyzed in the detailed report include:
- Zinc-Intensive Electronics Miniaturization
- Expansion of Zinc-Based Fertilizers in Micronutrient-Deficient Soils
- Material Substitution by Aluminum and Composites
For complete list of drivers and restraints, kindly check the Table Of Contents.
Segment Analysis
Refined output held 71.58% of total supply in 2025 as galvanizing lines favored standardized slabs for continuous-coil operations, locking in predictable off-take volumes across construction and auto sectors. This dominance shields producers from short-run demand shocks because contract logistics, quality assurance and credit terms are already embedded in long-standing supply chains that span mines, smelters and coil coaters. The refined slice of the zinc market therefore underpins working-capital planning for smelters that must move metal quickly to manage concentrate payables.
Growth, however, is tilting toward compounds as fertilizer blenders, electronics makers and battery innovators seek value-added derivatives that lift margins and cut shipping costs per dollar of revenue. A 2.73% CAGR through 2031 places compounds among the fastest-rising niches in the broader zinc market, helped by India's push to fortify soils and by pilot plants that turn high-purity oxide into zinc-air cathodes.
Primary mining and smelting accounted for 65.10% of 2025 tonnage, anchored by globally significant operations such as Red Dog, Rampura Agucha and Antamina that deliver concentrates with reliable impurity profiles. These assets enable long-term concentrate contracts that support downstream integration and provide feedstock security for galvanizers tied to infrastructure roll-outs. Even so, mine-grade deterioration and stricter ESG disclosure rules are inflating sustaining capital costs, pinching margins when spot treatment charges soften in surplus years.
Secondary production is meanwhile advancing 2.55% a year as urban-mine flows of steel-making dust, die-cast scrap and EAF residues expand in line with scrap-steel consumption. Collection networks across the European Union and North America already divert more than 1.7 million t of residues annually, giving recyclers a cost base that beats most greenfield mines on an all-in-sustaining-cost basis.
The Zinc Report is Segmented by Form (Refined Zinc (Slab), Zinc Alloys, and More), Production Process (Primary Production (Mining and Smelting) and Secondary Production (Recycling)), Application (Galvanizing, Die-Casting, Brass, and More), End-User Industry (Construction, Transportation, Electrical and Electronics, and More), and Geography (Asia-Pacific, North America, Europe, South America, and Middle-East and Africa).
Geography Analysis
Asia-Pacific controlled 62.25% of global shipments in 2025 and will expand by 2.38% annually to 2031, propelled by China's infrastructure pipeline and India's fertilizer push. Local smelters enjoy freight advantages to neighboring steel mills, strengthening regional self-sufficiency even as concentrate imports tighten. Government directives that favor low-carbon metal add premium layers for early adopters, reinforcing competitive moats for vertically integrated players.
North America maintains a meaningful role despite chronic concentrate deficits, with U.S. import reliance offset by strategic assets such as Red Dog in Alaska. Investment in the Hermosa project signals a policy turn toward domestic critical-mineral capacity, which could shift trade flows after 2028. Canada and Mexico provide additional mine supply and smelting output, leveraging proximity to automotive and construction hubs.
Europe's demand outlook is moderate but increasingly value-oriented, as automakers and renewable developers prioritize certified low-carbon slabs. Recycling infrastructure yields some of the globe's highest recovery ratios, keeping secondary metal close to major galvanizing clusters. Energy-price volatility remains a headwind for smelters; nonetheless, premium-grade chemical derivatives anchor specialty export niches.
Middle-East and Africa post accelerating demand tied to industrial-zone build-outs and mineral-resource development in Zambia and Namibia. Large-scale desalination, power-grid upgrades and transport corridors call for galvanized steel, while Gulf-based investors eye downstream alloy plants to add local value. South America rounds out the global map with Peru and Bolivia supplying high-grade concentrates to Asian smelters, sustaining a balanced portfolio of resource and demand centers for the zinc market.
- Boliden Group
- Glencore
- Grupo Mexico
- Hindustan Zinc (Vedanta)
- Hudbay Minerals Inc.
- Korea Zinc
- MMG Australia Limited
- Nexa
- Nyrstar
- South32
- Teck Resources Limited
- Vedanta Limited
- Volcan
Additional Benefits:
- The market estimate (ME) sheet in Excel format
- 3 months of analyst support
TABLE OF CONTENTS
1 Introduction
- 1.1 Study Assumptions and Market Definition
- 1.2 Scope of the Study
2 Research Methodology
3 Executive Summary
4 Market Landscape
- 4.1 Market Overview
- 4.2 Market Drivers
- 4.2.1 Infrastructure-led galvanizing demand surge
- 4.2.2 Growth of corrosion-resistant steel in EV and renewables
- 4.2.3 Zinc-intensive electronics miniaturisation
- 4.2.4 Expansion of zinc-based fertilisers in micronutrient-deficient soils
- 4.2.5 Emergence of zinc-ion and zinc-air batteries
- 4.3 Market Restraints
- 4.3.1 Stringent environmental and ESG regulations
- 4.3.2 Price volatility from supply surpluses
- 4.3.3 Material substitution by aluminium and composites
- 4.4 Value Chain Analysis
- 4.5 Porter's Five Forces
- 4.5.1 Bargaining Power of Suppliers
- 4.5.2 Bargaining Power of Buyers
- 4.5.3 Threat of New Entrants
- 4.5.4 Threat of Substitutes
- 4.5.5 Degree of Competition
5 Market Size and Growth Forecasts (Volume)
- 5.1 By Form
- 5.1.1 Refined Zinc (Slab)
- 5.1.2 Zinc Alloys
- 5.1.3 Zinc Compounds (Oxide, Sulfate, etc.)
- 5.1.4 Secondary/Recycled Zinc
- 5.2 By Production Process
- 5.2.1 Primary Production (Mining and Smelting)
- 5.2.2 Secondary Production (Recycling)
- 5.3 By Application
- 5.3.1 Galvanizing
- 5.3.2 Die-Casting
- 5.3.3 Brass
- 5.3.4 Zinc Oxide and Chemicals
- 5.3.5 Other Applications
- 5.4 By End-User Industry
- 5.4.1 Construction
- 5.4.2 Transportation
- 5.4.3 Electrical and Electronics
- 5.4.4 Consumer Goods
- 5.4.5 Other End-user Industries
- 5.5 Geography
- 5.5.1 Asia-Pacific
- 5.5.1.1 China
- 5.5.1.2 India
- 5.5.1.3 Japan
- 5.5.1.4 South Korea
- 5.5.1.5 Indonesia
- 5.5.1.6 Malaysia
- 5.5.1.7 Thailand
- 5.5.1.8 Vietnam
- 5.5.1.9 Rest of Asia-Pacific
- 5.5.2 North America
- 5.5.2.1 United States
- 5.5.2.2 Canada
- 5.5.2.3 Mexico
- 5.5.3 Europe
- 5.5.3.1 France
- 5.5.3.2 Germany
- 5.5.3.3 Italy
- 5.5.3.4 Nordic Countries
- 5.5.3.5 Russia
- 5.5.3.6 Spain
- 5.5.3.7 Turkey
- 5.5.3.8 United Kingdom
- 5.5.3.9 Rest of Europe
- 5.5.4 South America
- 5.5.4.1 Brazil
- 5.5.4.2 Argentina
- 5.5.4.3 Colombia
- 5.5.4.4 Rest of South America
- 5.5.5 Middle-East and Africa
- 5.5.5.1 Saudi Arabia
- 5.5.5.2 United Arab Emirates
- 5.5.5.3 Qatar
- 5.5.5.4 South Africa
- 5.5.5.5 Egypt
- 5.5.5.6 Nigeria
- 5.5.5.7 Rest of Middle-East and Africa
- 5.5.1 Asia-Pacific
6 Competitive Landscape
- 6.1 Market Concentration
- 6.2 Strategic Moves
- 6.3 Market Share Analysis
- 6.4 Company Profiles (includes Global level Overview, Market level overview, Core Segments, Financials as available, Strategic Information, Market Rank/Share for key companies, Products and Services, Recent Developments)
- 6.4.1 Boliden Group
- 6.4.2 Glencore
- 6.4.3 Grupo Mexico
- 6.4.4 Hindustan Zinc (Vedanta)
- 6.4.5 Hudbay Minerals Inc.
- 6.4.6 Korea Zinc
- 6.4.7 MMG Australia Limited
- 6.4.8 Nexa
- 6.4.9 Nyrstar
- 6.4.10 South32
- 6.4.11 Teck Resources Limited
- 6.4.12 Vedanta Limited
- 6.4.13 Volcan
7 Market Opportunities and Future Outlook
- 7.1 White-space and Unmet-Need Assessment

