
PUBLISHER: Mordor Intelligence | PRODUCT CODE: 1934916

PUBLISHER: Mordor Intelligence | PRODUCT CODE: 1934916
Data Center Colocation - Market Share Analysis, Industry Trends & Statistics, Growth Forecasts (2026 - 2031)
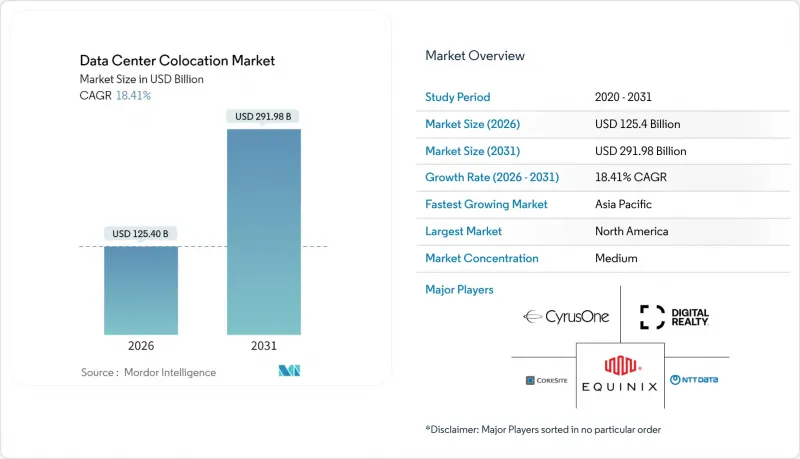
The data center colocation market was valued at USD 105.91 billion in 2025 and estimated to grow from USD 125.4 billion in 2026 to reach USD 291.98 billion by 2031, at a CAGR of 18.41% during the forecast period (2026-2031).
Demand is fueled by sovereign-AI mandates that require trusted neutral capacity, edge computing deployments that need distributed footprints, and the mainstreaming of liquid-cool-ready suites for rack densities above 40 kW. The accelerating shift from enterprise-owned facilities toward service-based models continues to favor neutral providers that offer cloud-on-ramp ecosystems, rapid deployment options, and energy-efficient designs. Private-equity ownership has become a defining force, allowing operators to finance mega-campus projects quickly even as interest rates remain elevated. The data center colocation market now spans every major industry vertical, and providers able to combine high-density AI infrastructure with compliance-ready environments are best positioned to capture incremental demand.
Global Data Center Colocation Market Trends and Insights
Increasing Integration of Cloud and SaaS Workloads
Hybrid-IT architectures now dominate enterprise roadmaps, pushing organizations to house latency-sensitive workloads in colocation facilities that sit one cross-connect away from major public clouds. Direct-connect ports to an average of 15-20 cloud platforms are becoming table stakes, enabling tenants to shrink egress fees and simplify regulatory compliance for multi-cloud deployments.Interconnection services already contribute 18% of total revenue for market leaders as customers accept 20-30% price premiums for plug-and-play cloud proximity.
Proliferation of Data from IoT/AI and Edge Workloads
Generative-AI training clusters routinely draw 40-80 kW per rack, a power envelope unsustainable in legacy air-cooled halls. Operators are therefore fitting liquid manifolds and immersion tanks to support GPU rigs that devour 3-5 times the electricity of traditional racks. Parallel edge rollouts place micro-nodes near factories, stadia and telco towers, all funneling traffic back to hub colocation sites via dark-fiber rings. This hub-and-spoke topology lets enterprises run real-time analytics while maintaining centralized governance.
High Up-Front Build Cost Amid Elevated Interest Rates
Average U.S. shell-and-core outlays climbed to USD 468.66 per sq ft in 2024 as steel, switchgear and fuel prices rose in tandem with financing costs. Developers are mitigating sticker shock through prefabricated modules, asset-backed securitizations and credit-tenant leases, but permitting queues still stretch delivery cycles to 18-24 months. Balance-sheet strength is therefore becoming a competitive advantage as nimble buyers pre-fund capacity before rivals even secure zoning approval.
Other drivers and restraints analyzed in the detailed report include:
- Stricter Data-Sovereignty Laws Boosting In-Country Demand
- AI-Driven Workload Density Requiring Liquid-Cool-Ready Suites
- Chronic Grid-Power and Land Shortages in Tier-1 Metros
For complete list of drivers and restraints, kindly check the Table Of Contents.
Segment Analysis
Retail facilities commanded 52.18% of data center colocation market share in 2025, largely because enterprises value the convenience of cross-connect-rich ecosystems and turnkey services. Wholesale offerings targeting single-tenant hyperscalers supply larger footprints but face margin compression as hyperscalers develop self-build capabilities. The modular/edge-pod subsegment, growing at a 18.74% CAGR, represents the industry's fastest-rising revenue stream and highlights the pivot toward proximity-driven compute. Providers such as Digital Realty have added factory-built modules to traditional campuses, combining standardized design with rapid deployment for under-served metros. These hybrid estates enable operators to allocate capital more flexibly, match density tiers to workload profiles, and capture new demand nodes that previously defaulted to on-premises closets.
Operators keen to defend retail share now bundle managed-network fabrics, compliance attestations, and AI-ready cages, blurring historical boundaries between retail and wholesale. Contracts increasingly feature consumption-based pricing models similar to cloud, attracting cloud-native startups seeking predictable cost alignment. As enterprises shuffle workloads between hyperscale clouds and edge pods, the data center colocation market is effectively segmenting into core-edge continuums rather than distinct facility classes. Providers that orchestrate capacity-planning across this continuum stand to expand cross-sell revenue and reduce churn.
Tier III facilities held 55.26% of the data center colocation market size in 2025 because they balance redundancy with cost efficiency for most enterprise workloads. Financial trading, AI training, and life-safety applications, however, require the 99.995% uptime of Tier IV, driving an 18.25% CAGR forecast for that class through 2031. The architectural shift includes tri-mode UPS configurations, 2N+1 cooling topologies, and predictive-maintenance analytics that pre-empt failures. Hyperscale tenants often sign anchor leases that justify the higher capital intensity, improving the return profile for operators.
Regulators in finance and healthcare now incorporate uptime standards into licensing, effectively hard-coding Tier III as the minimum acceptable standard while rewarding Tier IV with accelerated vendor-approval cycles. This compliance halo inflates perceived value, allowing operators to secure longer contract terms and higher recurring revenue per square foot. As more AI workloads transition from R&D to production, expect Tier IV adoption to expand beyond its high-performance niche, underpinning steady share gains in the data center colocation market.
Data Center Colocation Market Report is Segmented by Colocation Type (Retail, Wholesale), Tier Standard (Tier I and II, Tier III, Tier IV), Data Center Size (Small, Medium and More), End-User Industry (BFSI, IT and Telecom, E-Commerce and Retail, Government and Defense, and More), and by Geography(North America and Europe and More). The Market Forecasts are Provided in Terms of Value (USD).
Geography Analysis
North America retained 39.88% demand in 2025, North America remains the largest revenue contributor thanks to decades of dark-fiber build-out, dense internet-exchange fabrics, and a mature hyperscale footprint that underpins cloud GDP. Power moratoriums in Northern Virginia and Silicon Valley, however, are steering new demand to Phoenix, Columbus, and Montreal, where utilities can still green-light 100 MW blocks inside 24 months. Local governments in these secondary hubs court developers with tax holidays and expedited permitting, tempering the land-scarcity issues dogging legacy metros.
Asia-Pacific is the fastest mover, Asia-Pacific is forecast to post a 24.95% CAGR through 2031. China's digital-public-infrastructure drive, India's commerce-cloud adoption, and Japan's stringent data-residency amendments are all piling megawatt orders into regional pipelines. Singapore has reinstated a constrained build quota, funneling spill-over demand to Johor and Batam. Meanwhile, Australia, Indonesia and the Philippines are receiving first-time hyperscale commitments, positioning the bloc to outpace every other continent in incremental capacity through 2031.
Europe, South America and the Middle East-Africa corridor form the third growth tier. Frankfurt, Dublin and Madrid handle continental overflow as Amsterdam imposes stricter energy-efficiency hurdles. Sao Paulo is emerging as a southern-hemisphere hub, whereas Riyadh is leveraging sovereign capital to erect new digital corridors linked to Vision 2030 goals. Across all regions, renewable accessibility and streamlined grid interconnections are decisive site-selection filters, making wind-rich Patagonia and solar-dense Emirates unexpectedly attractive for the next wave of builds.
- Equinix Inc.
- Digital Realty Trust Inc.
- NTT Global Data Centers
- CyrusOne Inc.
- CoreSite Realty Corp.
- Cyxtera Technologies Inc.
- Iron Mountain Data Centers
- KDDI (telehouse)
- Flexential Corp.
- Rackspace Technology Inc.
- Vantage Data Centers
- QTS Data Centers (Blackstone)
- Switch Inc.
- EdgeConneX
- Stack Infrastructure
- Aligned Data Centers
- Global Switch
- Telefonica Tech
- China Telecom Global
- Scala Data Centers
- Teraco Data Environments
- Keppel DC REIT
Additional Benefits:
- The market estimate (ME) sheet in Excel format
- 3 months of analyst support
TABLE OF CONTENTS
1 INTRODUCTION
- 1.1 Study Assumptions and Market Definition
- 1.2 Scope of the Study
2 RESEARCH METHODOLOGY
3 EXECUTIVE SUMMARY
4 MARKET LANDSCAPE
- 4.1 Market Overview
- 4.2 Market Drivers
- 4.2.1 Increasing integration of cloud and SaaS workloads
- 4.2.2 Proliferation of data from IoT/AI and edge workloads
- 4.2.3 Stricter data-sovereignty laws boosting in-country colo demand
- 4.2.4 Emergence of SMR-based on-site nuclear power for mega campuses
- 4.2.5 AI-driven workload density requiring liquid-cool-ready colo suites
- 4.2.6 Sovereign AI initiatives requiring trusted third-party capacity
- 4.3 Market Restraints
- 4.3.1 High up-front build cost amid elevated interest rates
- 4.3.2 Chronic grid-power and land shortages in Tier-1 metros
- 4.3.3 Carbon-tax escalation raising opex unpredictability
- 4.3.4 Rising insurance premiums linked to climate risk
- 4.4 Supply-Chain Analysis
- 4.5 Regulatory Landscape
- 4.6 Technological Outlook
- 4.7 Porter's Five Forces
- 4.7.1 Bargaining Power of Suppliers
- 4.7.2 Bargaining Power of Buyers
- 4.7.3 Threat of New Entrants
- 4.7.4 Threat of Substitutes
- 4.7.5 Intensity of Competitive Rivalry
- 4.8 Assesment of Macroeconomic Factors on the Market
5 MARKET SIZE AND GROWTH FORECASTS (VALUE)
- 5.1 By Colocation Type
- 5.1.1 Retail
- 5.1.2 Wholesale
- 5.2 By Tier Standard
- 5.2.1 Tier I & II
- 5.2.2 Tier III
- 5.2.3 Tier IV
- 5.3 By Data Center Size
- 5.3.1 Small
- 5.3.2 Medium
- 5.3.3 Large
- 5.3.4 Massive
- 5.3.5 Mega
- 5.4 By End-user Industry
- 5.4.1 BFSI
- 5.4.2 IT and Telecom
- 5.4.3 E-commerce and Retail
- 5.4.4 Government and Defense
- 5.4.5 Manufacturing and Industrial IoT
- 5.4.6 Media and Entertainment
- 5.4.7 Healthcare and Life Sciences
- 5.4.8 Energy and Utilities
- 5.5 By Geography
- 5.5.1 North America
- 5.5.1.1 United States
- 5.5.1.2 Canada
- 5.5.1.3 Mexico
- 5.5.2 South America
- 5.5.2.1 Brazil
- 5.5.2.2 Argentina
- 5.5.2.3 Rest of South America
- 5.5.3 Europe
- 5.5.3.1 United Kingdom
- 5.5.3.2 Germany
- 5.5.3.3 France
- 5.5.3.4 Italy
- 5.5.3.5 Spain
- 5.5.3.6 Russia
- 5.5.3.7 Rest of Europe
- 5.5.4 Asia-Pacific
- 5.5.4.1 China
- 5.5.4.2 Japan
- 5.5.4.3 India
- 5.5.4.4 South Korea
- 5.5.4.5 Australia and New Zealand
- 5.5.4.6 Rest of Asia-Pacific
- 5.5.5 Middle East and Africa
- 5.5.5.1 Middle East
- 5.5.5.1.1 Saudi Arabia
- 5.5.5.1.2 UAE
- 5.5.5.1.3 Turkey
- 5.5.5.1.4 Rest of Middle East
- 5.5.5.2 Africa
- 5.5.5.2.1 South Africa
- 5.5.5.2.2 Nigeria
- 5.5.5.2.3 Kenya
- 5.5.5.2.4 Rest of Africa
- 5.5.5.1 Middle East
- 5.5.1 North America
6 COMPETITIVE LANDSCAPE
- 6.1 Market Share Analysis
- 6.2 Company Profiles (includes Global level Overview, Market level overview, Core Segments, Financials as available, Strategic Information, Market Rank/Share for key companies, Products and Services, and Recent Developments)
- 6.2.1 Equinix Inc.
- 6.2.2 Digital Realty Trust Inc.
- 6.2.3 NTT Global Data Centers
- 6.2.4 CyrusOne Inc.
- 6.2.5 CoreSite Realty Corp.
- 6.2.6 Cyxtera Technologies Inc.
- 6.2.7 Iron Mountain Data Centers
- 6.2.8 KDDI (telehouse)
- 6.2.9 Flexential Corp.
- 6.2.10 Rackspace Technology Inc.
- 6.2.11 Vantage Data Centers
- 6.2.12 QTS Data Centers (Blackstone)
- 6.2.13 Switch Inc.
- 6.2.14 EdgeConneX
- 6.2.15 Stack Infrastructure
- 6.2.16 Aligned Data Centers
- 6.2.17 Global Switch
- 6.2.18 Telefonica Tech
- 6.2.19 China Telecom Global
- 6.2.20 Scala Data Centers
- 6.2.21 Teraco Data Environments
- 6.2.22 Keppel DC REIT
7 MARKET OPPORTUNITIES AND FUTURE OUTLOOK
- 7.1 White-space and Unmet-Need Assessment

