
PUBLISHER: Mordor Intelligence | PRODUCT CODE: 1937309

PUBLISHER: Mordor Intelligence | PRODUCT CODE: 1937309
Silica Sand - Market Share Analysis, Industry Trends & Statistics, Growth Forecasts (2026 - 2031)
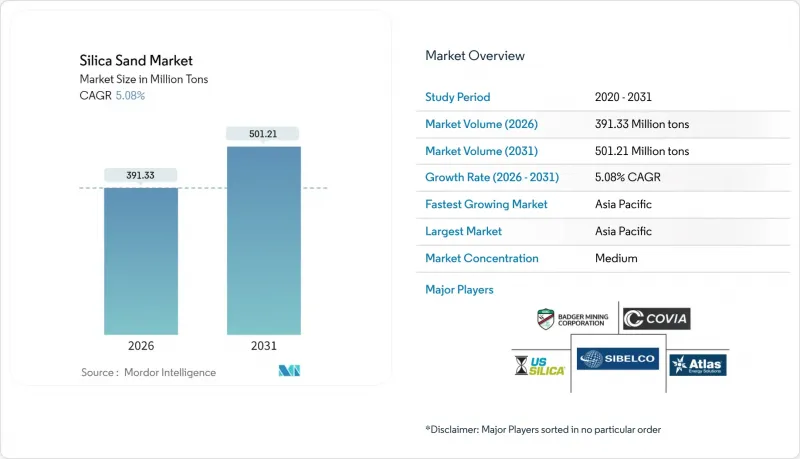
The Silica Sand market is expected to grow from 372.42 Million tons in 2025 to 391.33 Million tons in 2026 and is forecast to reach 501.21 Million tons by 2031 at 5.08% CAGR over 2026-2031.
The upward trajectory is tied to the central role the mineral plays in high-purity glass, semiconductor wafers, hydraulic fracturing proppants, and a wide array of industrial fillers. Price premiums for ultra-clear solar glass, persistent growth in shale well counts, and the spread of semiconductor fabs into new regions are together sustaining demand even as environmental regulations tighten. Supply chains are gradually localizing, with in-basin mines and downstream alliances offsetting logistics costs and minimizing exposure to permitting delays. Competitive differentiation is increasingly anchored in quality certification, dust-mitigation technology, and traceability systems that help buyers manage health-and-safety compliance.
Global Silica Sand Market Trends and Insights
Rising Demand for Premium-Clarity Flat and Solar Glass
Solar-grade glass plants require feedstock exceeding 99.99% SiO2, pushing spot prices toward USD 55 per ton as China's photovoltaic capacity additions tighten availability for conventional float glass lines. Canadian Premium Sand and other entrants plan vertically integrated furnaces to satisfy more than 100 GW of panel output by 2027. Multinational float-glass makers have earmarked close to USD 180 million for furnace retrofits that boost energy efficiency while locking in long-term offtake contracts for high-purity sand, underscoring trends in the silica sand market. These capital commitments confirm that premium silica will remain a supply-critical input while manufacturers pursue low-carbon glass production techniques certified under ISO 9001 standards.
Surging Frac-Sand Intensity per Shale Well
Individual horizontal wells now average 1,060% more sand than in 2013, driven by longer laterals and higher stage counts. Wet-sand logistics cut diesel usage by 90% and shave USD 100,000-300,000 per well, accelerating the switch to in-basin brown sand that reduces delivered-cost volatility. OSHA respirable-silica rules are spurring adoption of new dust-capture hoods and enclosed conveyors trends in the silica sand market locking in specification-driven procurement that favors certified suppliers.
Escalating Environmental Permitting Hurdles
The MSHA silica rule that took effect in June 2024 lowered permissible exposure to 50 µg/m3 and added mandatory medical surveillance, raising compliance costs for both new and legacy pits. In Manitoba, Sio Silica's proposed mine remains stalled after regulators called for a deeper hydro-geological review. European Chemicals Agency drafts signal tighter workplace exposure requirements that could cut output at smaller quarries lacking enclosed processing circuits. The higher hurdle rate is expected to curtail grassroots projects and concentrate production among operators with full ESG reporting frameworks.
Other drivers and restraints analyzed in the detailed report include:
- Growth in High-Purity Silica for Semiconductor Fabs
- Infrastructure Stimulus-Led Concrete Consumption
- Rapid Substitution by Recycled Cullet in Container Glass
For complete list of drivers and restraints, kindly check the Table Of Contents.
Segment Analysis
High-purity grades above 99.5% SiO2 account for 6.19% CAGR, the fastest within the silica sand market. Ultra-pure sand provides the substrate for semiconductor crucibles, solar float glass, and lithium-ion battery separators. Sibelc o's Spruce Pine expansion and Australian Silica Quartz Group's push to 99.997% purity illustrate the scale-up of value-added capacity.
Standard-grade material ranging from 95-99.5% SiO2 remains the volume anchor, holding 47.58% of the 2025 silica sand market share. Demand stems from foundry molds, construction aggregates, and filter media. Innovations such as iron-ore tailings purification that lifts rejects to 99.99% purity blend sustainability with revenue upside, though low-purity sand below 95% SiO2 is largely restricted to local ready-mix and backfill usage.
The Silica Sand Report is Segmented by Purity Level (High-Purity More Than 99. 5% SiO2, Standard 95-99. 5%, Low-Purity Less Than 95%), End-User Industry (Glass Manufacturing, Foundry, Chemical Production, Construction, Paints and Coatings, Ceramics and Refractories, Filtration, Oil and Gas, and Other End-User Industries), and Geography (Asia-Pacific, North America, Europe, South America, and Middle-East and Africa).
Geography Analysis
Asia-Pacific commands 40.21% of global volume and is projected to grow at a 6.27% CAGR, driven by China's photovoltaic boom, India's urban transport corridors, and Indonesia's USD 45.74 billion silicon-downstream agenda. Australia's Cape Flattery mine, grading 99.93% SiO2, positions Queensland to triple output before 2030.
North America's consumption is propelled by shale proppant at the core. The United States exported USD 809 million worth of silica sand during 2024-2025, with Canada and Japan the top buyers. Mexico's growing manufacturing sector drives imports, benefiting from USMCA trade relationships and proximity to U.S. suppliers. The region's regulatory environment intensifies with new MSHA silica rules effective June 2024, requiring comprehensive exposure monitoring and medical surveillance programs.
Europe faces challenging conditions in silica sand industry with construction demand slowdowns affecting traditional silica sand applications, though specialized segments maintain growth momentum. The European Chemicals Agency's draft exposure limits may concentrate supply in Northern Europe where enclosed processing is already standard. Middle East and Africa draw on infrastructure projects and glass container demand, while South America's allure lies in automotive supply-chain shifts and new critical-minerals policies.
- Atlas Energy Solutions Inc. (Hi-Crush Inc.)
- Badger Mining Corporation
- Chongqing Changjiang River Moulding Material Group Co. Ltd
- COVIA HOLDINGS LLC
- Euroquarz GmbH
- Gulf Coast Sand
- JFE Mineral & Alloy Company Ltd
- Mitsubishi Corporation
- PUM GROUP
- Sibelco
- Sil Industrial Minerals
- Source Energy Services
- Superior Silica Sands
- TOCHU CORPORATION
- U.S. Silica (Apollo Global Management)
Additional Benefits:
- The market estimate (ME) sheet in Excel format
- 3 months of analyst support
TABLE OF CONTENTS
1 Introduction
- 1.1 Study Assumptions and Market Definition
- 1.2 Scope of the Study
2 Research Methodology
3 Executive Summary
4 Market Landscape
- 4.1 Market Overview
- 4.2 Market Drivers
- 4.2.1 Rising demand for premium-clarity flat and solar glass
- 4.2.2 Surging frac-sand intensity per shale well
- 4.2.3 Growth in high-purity silica for semiconductor fabs
- 4.2.4 Infrastructure stimulus-led concrete consumption
- 4.2.5 AI-driven foundry process optimisation
- 4.3 Market Restraints
- 4.3.1 Escalating environmental permitting hurdles
- 4.3.2 Rapid substitution by recycled cullet in container glass
- 4.3.3 Emerging low-quartz proppants (ceramics, resin-coated)
- 4.4 Value Chain Analysis
- 4.5 Porter's Five Forces
- 4.5.1 Bargaining Power of Suppliers
- 4.5.2 Bargaining Power of Buyers
- 4.5.3 Threat of New Entrants
- 4.5.4 Threat of Substitutes
- 4.5.5 Degree of Competition
5 Market Size and Growth Forecasts (Value and Volume)
- 5.1 By Purity Level
- 5.1.1 High-Purity (more than 99.5% SiO2)
- 5.1.2 Standard (95 to 99.5%)
- 5.1.3 Low-Purity (less than 95%)
- 5.2 By End-user Industry
- 5.2.1 Glass Manufacturing
- 5.2.2 Foundry
- 5.2.3 Chemical Production
- 5.2.4 Construction
- 5.2.5 Paints and Coatings
- 5.2.6 Ceramics and Refractories
- 5.2.7 Filtration
- 5.2.8 Oil and Gas
- 5.2.9 Other End-user Industries
- 5.3 By Geography
- 5.3.1 Asia-Pacific
- 5.3.1.1 China
- 5.3.1.2 India
- 5.3.1.3 Japan
- 5.3.1.4 South Korea
- 5.3.1.5 Indonesia
- 5.3.1.6 Australia
- 5.3.1.7 Rest of Asia-Pacific
- 5.3.2 North America
- 5.3.2.1 United States
- 5.3.2.2 Canada
- 5.3.2.3 Mexico
- 5.3.3 Europe
- 5.3.3.1 Germany
- 5.3.3.2 United Kingdom
- 5.3.3.3 Italy
- 5.3.3.4 France
- 5.3.3.5 Russia
- 5.3.3.6 Rest of Europe
- 5.3.4 South America
- 5.3.4.1 Brazil
- 5.3.4.2 Argentina
- 5.3.4.3 Rest of South America
- 5.3.5 Middle-East and Africa
- 5.3.5.1 Saudi Arabia
- 5.3.5.2 United Arab Emirates
- 5.3.5.3 South Africa
- 5.3.5.4 Rest of Middle-East and Africa
- 5.3.1 Asia-Pacific
6 Competitive Landscape
- 6.1 Market Concentration
- 6.2 Strategic Moves
- 6.3 Market Share (%)/Ranking Analysis
- 6.4 Company Profiles (includes Global level Overview, Market level overview, Core Segments, Financials as available, Strategic Information, Market Rank/Share for key companies, Products and Services, and Recent Developments)
- 6.4.1 Atlas Energy Solutions Inc. (Hi-Crush Inc.)
- 6.4.2 Badger Mining Corporation
- 6.4.3 Chongqing Changjiang River Moulding Material Group Co. Ltd
- 6.4.4 COVIA HOLDINGS LLC
- 6.4.5 Euroquarz GmbH
- 6.4.6 Gulf Coast Sand
- 6.4.7 JFE Mineral & Alloy Company Ltd
- 6.4.8 Mitsubishi Corporation
- 6.4.9 PUM GROUP
- 6.4.10 Sibelco
- 6.4.11 Sil Industrial Minerals
- 6.4.12 Source Energy Services
- 6.4.13 Superior Silica Sands
- 6.4.14 TOCHU CORPORATION
- 6.4.15 U.S. Silica (Apollo Global Management)
7 Market Opportunities and Future Outlook
- 7.1 White-space and Unmet-Need Assessment

