
PUBLISHER: Mordor Intelligence | PRODUCT CODE: 1937378

PUBLISHER: Mordor Intelligence | PRODUCT CODE: 1937378
Benzene-Toluene-Xylene (BTX) - Market Share Analysis, Industry Trends & Statistics, Growth Forecasts (2026 - 2031)
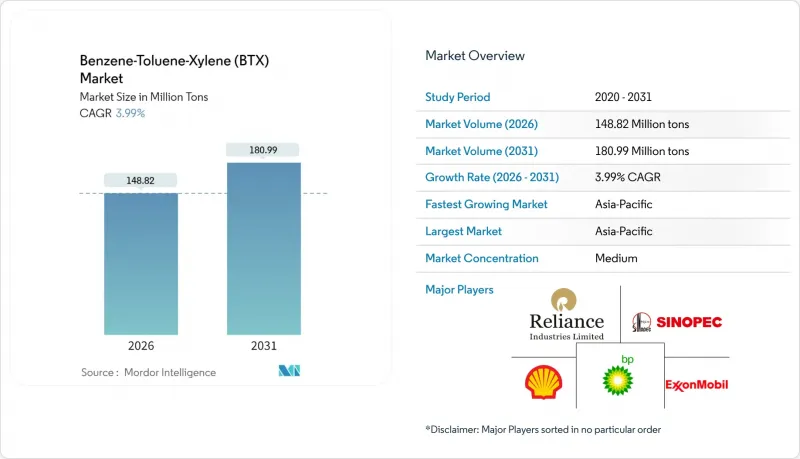
Benzene-Toluene-Xylene (BTX) market size in 2026 is estimated at 148.82 Million tons, growing from 2025 value of 143.11 Million tons with 2031 projections showing 180.99 Million tons, growing at 3.99% CAGR over 2026-2031.
Robust downstream demand for plastics, synthetic fibers and specialty chemicals keeps global aromatics complexes operating at high utilization rates, while new capacity in Asia-Pacific shifts trade flows and intensifies competitive pressure. Accelerating para-xylene off-take for PET, resurging toluene di-isocyanate demand from polyurethane foam, and the commercialization of biomass- and pyro-plastic routes collectively reinforce a steady, volume-based expansion of the BTX market. Regional imbalances are pronounced: Asia-Pacific secures cost-advantaged feedstocks and leverages integrated complexes, North America wrestles with elevated production costs and rising imports, and Europe undergoes rationalization in response to tightening environmental regulation. Competitive behavior gravitates toward feedstock integration, technology modernization and selective consolidation as high-cost players seek resilience in a cyclical pricing environment.
Global Benzene-Toluene-Xylene (BTX) Market Trends and Insights
CAPEX boom in new aromatics complexes (Asia and Middle-East)
The Asia-Pacific plans to add 5.45 million tons of additional benzene capacity by 2030, including 3.29 million tons in India, underpinned by refinery upgrades and grassroots projects tailored for export-oriented trade. Saudi downstream integration follows a similar trajectory: the Aramco-Sinopec-Yasref framework targets a 1.5 million-ton aromatics complex colocated with a 1.8 million-ton mixed-feed cracker to maximize feedstock synergy. Economies of scale, advantaged naphtha and condensate streams, and proximity to rising Asian demand underpin this investment wave. While the capacity infusion will deepen regional self-sufficiency, it raises the risk of oversupply for commodity benzene and mixed xylene grades produced in Europe and North America. Cost-curve displacement, therefore, favors integrated, feedstock-advantaged operators and pressures independent, higher-cost refiners.
Surging PET demand keeps para-xylene balances tight
Global para-xylene output topped 57 million tons in 2023 on the back of China's rapid capacity build-out devoted to PET bottle resin and textile filament. Sustainability legislation drives the adoption of recycled PET in mature markets, yet virgin para-xylene volumes continue to rise in populous economies with limited collection infrastructure. Tight balances have sustained para-xylene premiums over mixed xylene feedstocks, offsetting margin weakness in benzene and toluene pools. Producer economics benefit from the para-xylene-PET linkage, and the dynamic supports long-range contracts between refineries and integrated polyester chains.
Carcinogenicity-driven occupational exposure curbs
Benzene's classification as a Group 1 carcinogen underpins workplace exposure limits that tighten to as low as 20 mg/m3 for certain surface-treatment operations in the European Union. Compliance requires continuous monitoring, vapor recovery units, and active-carbon adsorption systems, adding operating costs across production, storage, and transport. Petrochemical sites invest in hermetic loading arms, nitrogen inerting, and advanced personal protective equipment to safeguard workers. Although capital-intensive, these measures reduce incident risk and potential liabilities, making compliance an essential prerequisite for operating in the BTX market.
Other drivers and restraints analyzed in the detailed report include:
- Automotive and construction rebound lifts TDI/paints solvent demand
- Refinery-petchem integration unlocking captive BTX extraction
- Paints/adhesives VOC regulations favor low-aromatic blends
For complete list of drivers and restraints, kindly check the Table Of Contents.
Segment Analysis
Benzene retained a 38.21% BTX market share in 2025, supported by deep integration into styrenics, nylon, and phenolics value chains that anchor demand across packaging, automotive, and construction. Selective toluene disproportionation, hydrodealkylation, and catalytic reforming ensure a steady supply, yet benzene's cost structure remains vulnerable to light-naphtha cracks and regional sourcing disparities. North American operating rates drifted near 72% in 2024, and forecast margin compression could push utilization below 70% in 2025. Imports from Asia supplied more than 60% of U.S. benzene inflows through October 2024 as arbitrage windows briefly opened; parity pricing is expected to narrow those inflows. Conversion flexibility allows refiners to swing between benzene and para-xylene, but physical constraints on reformate quality impose limits.
Toluene, although representing a smaller volume base, exhibits the fastest 4.44% CAGR through 2031, driven by the recovery of TDI and the evolution of solvent demand. Disproportionation technologies such as UOP's Tatoray and Sinopec's MST aim to exploit favorable benzene-toluene spreads by converting surplus toluene into high-value benzene and para-xylene. Improved catalyst lifetimes and lower hydrogen consumption enhance process economics, prompting retrofit interest among Middle Eastern complexes targeting captive benzene supply for downstream expansions. Xylene isomers collectively bridge the benzene and toluene pools: para-xylene captures PET growth, ortho-xylene feeds phthalic anhydride for PVC plasticizers, and meta-xylene underpins isophthalic resin demand. Although xylene availability follows reformer severity and reformate fractionation yields, opportunistic imports accommodate shortfalls, underscoring the increasingly globalized BTX market.
The Benzene-Toluene-Xylene (BTX) Market Report is Segmented by Type (Benzene, Toluene, and Xylene), Application (Ethylbenzene, Cyclohexane, Alkylbenzene, Cumene, Nitrobenzene, Paints and Coatings, Adhesives and Inks, Explosives, Chemical Intermediates, Solvents, Monomer), and Geography (North America, South America, Europe, Asia-Pacific, and Middle East and Africa). The Market Forecasts are Provided in Terms of Volume (Tons).
Geography Analysis
The Asia-Pacific region held a commanding 62.35% BTX market share in 2025 and sustained the fastest 4.12% CAGR to 2031, driven by integrated refinery-petrochemical hubs in China, India, and South Korea. China alone plans to schedule 3.088 million tons of new xylene capacity for H2 2025, primarily targeting para-xylene for captive PET lines. India's 3.29 million tons of benzene capacity announced for start-up by 2030 positions the country as a rising exporter of merchant grades. Despite its scale advantages, the region faces an oversupply risk as multiple grassroots projects come online concurrently, as evidenced by HD Hyundai Cosmo's acquisition for USD 104 million, following sustained losses attributed to Chinese competition. Nonetheless, e-commerce-led packaging growth, resilient automotive output, and infrastructure programs underpin steady volume absorption.
North America's BTX supply landscape contracts as styrene monomer units in Sarnia and Ohio shut down, lowering regional benzene self-sufficiency and increasing import reliance from Asia and the Middle East. Elevated natural-gas-based ethane cracking caps reformate aromatics output, squeezing benzene supply in a market already challenged by flat downstream demand. Europe continues a rationalization pathway that removed 14 million tons of aromatics and cracker capacity since 2023; operators confront carbon-pricing schemes and VOC directives requiring plant upgrades that strain return profiles. Policy-driven energy costs further erode competitiveness, prompting asset swaps or closures.
The Middle East rests on advantaged naphtha and condensate streams, enabling low cash-cost BTX production integrated with new mixed-feed crackers at sites such as Yanbu. Export orientation suits emerging deficits in Africa and South Asia, while proximity to Asia keeps freight optionality wide open. South America and Africa comprise smaller demand centers but gain relevance as automotive assembly lines ramp up and building projects resume following pandemic-delayed timelines. The geographic restructuring of BTX production toward advantaged regions reshapes trade patterns and might compress arbitrage windows that historically balanced global deficits.
- BASF
- BP p.l.c.
- Chevron Phillips Chemical Company LLC
- China Petrochemical Corporation
- China National offshore Oil Corporation (CNOOC)
- Dow
- ENEOS Corporation
- Exxon Mobil Corporation
- Formosa Plastics Group.
- GS Caltex Corporation
- INEOS
- IRPC Public Company Limited
- JFE Chemical Corporation
- JX Nippon Oil & Gas Exploration Corporation (ENEOS)
- Mitsubishi Gas Chemical Trading, Inc.
- MOLGROUP
- OCI COMPANY Ltd.
- Reliance Industries Limited
- SABIC
- Shell plc
- S-OIL CORPORATION
- TotalEnergies
- YEOCHUN NCC CO., LTD.
Additional Benefits:
- The market estimate (ME) sheet in Excel format
- 3 months of analyst support
TABLE OF CONTENTS
1 Introduction
- 1.1 Study Assumptions and Market Definition
- 1.2 Scope of the Study
2 Research Methodology
3 Executive Summary
4 Market Landscape
- 4.1 Market Overview
- 4.2 Market Drivers
- 4.2.1 CAPEX boom in new aromatics complexes (Asia and Middle-East)
- 4.2.2 Surging PET demand keeps para-xylene balances tight
- 4.2.3 Automotive and construction rebound lifts TDI/paints solvent demand
- 4.2.4 Refinery-petchem integration unlocking captive BTX extraction
- 4.2.5 Pyro-plastic and biomass routes commercialising drop-in BTX
- 4.3 Market Restraints
- 4.3.1 Carcinogenicity-driven occupational exposure curbs
- 4.3.2 Paints/adhesives VOC regulations favour low-aromatic blends
- 4.3.3 Octane-for-aromatics trade-off in gasoline pool after E10 rollout
- 4.4 Value Chain Analysis
- 4.5 Porter's Five Forces
- 4.5.1 Bargaining Power of Suppliers
- 4.5.2 Bargaining Power of Buyers
- 4.5.3 Threat of New Entrants
- 4.5.4 Threat of Substitutes
- 4.5.5 Degree of Competition
5 Market Size and Growth Forecasts (Volume)
- 5.1 By Type
- 5.1.1 Benzene
- 5.1.2 Toluene
- 5.1.3 Xylene
- 5.1.3.1 Ortho-xylene
- 5.1.3.2 Meta-xylene
- 5.1.3.3 Para-xylene
- 5.2 By Application
- 5.2.1 Benzene
- 5.2.1.1 Ethylbenzene
- 5.2.1.2 Cyclohexane
- 5.2.1.3 Alkylbenzene
- 5.2.1.4 Cumene
- 5.2.1.5 Nitrobenzene
- 5.2.1.6 Other Applications
- 5.2.2 Toluene
- 5.2.2.1 Paints and Coatings
- 5.2.2.2 Adhesives and Inks
- 5.2.2.3 Explosives
- 5.2.2.4 Chemical Intermediates
- 5.2.3 Xylenes
- 5.2.3.1 Solvents
- 5.2.3.2 Monomer
- 5.2.3.3 Other Applications
- 5.2.1 Benzene
- 5.3 By Geography
- 5.3.1 Asia-Pacific
- 5.3.1.1 China
- 5.3.1.2 India
- 5.3.1.3 Japan
- 5.3.1.4 South Korea
- 5.3.1.5 Rest of Asia-Pacific
- 5.3.2 North America
- 5.3.2.1 United States
- 5.3.2.2 Canada
- 5.3.2.3 Mexico
- 5.3.3 Europe
- 5.3.3.1 Germany
- 5.3.3.2 United Kingdom
- 5.3.3.3 Italy
- 5.3.3.4 France
- 5.3.3.5 Rest of Europe
- 5.3.4 South America
- 5.3.4.1 Brazil
- 5.3.4.2 Argentina
- 5.3.4.3 Rest of South America
- 5.3.5 Middle East and Africa
- 5.3.5.1 Saudi Arabia
- 5.3.5.2 South Africa
- 5.3.5.3 Rest of Middle East and Africa
- 5.3.1 Asia-Pacific
6 Competitive Landscape
- 6.1 Market Concentration
- 6.2 Strategic Moves
- 6.3 Market Share (%)/Ranking Analysis
- 6.4 Company Profiles (includes Global level Overview, Market level overview, Core Segments, Financials as available, Strategic Information, Market Rank/Share, Products and Services, Recent Developments)
- 6.4.1 BASF
- 6.4.2 BP p.l.c.
- 6.4.3 Chevron Phillips Chemical Company LLC
- 6.4.4 China Petrochemical Corporation
- 6.4.5 China National offshore Oil Corporation (CNOOC)
- 6.4.6 Dow
- 6.4.7 ENEOS Corporation
- 6.4.8 Exxon Mobil Corporation
- 6.4.9 Formosa Plastics Group.
- 6.4.10 GS Caltex Corporation
- 6.4.11 INEOS
- 6.4.12 IRPC Public Company Limited
- 6.4.13 JFE Chemical Corporation
- 6.4.14 JX Nippon Oil & Gas Exploration Corporation (ENEOS)
- 6.4.15 Mitsubishi Gas Chemical Trading, Inc.
- 6.4.16 MOLGROUP
- 6.4.17 OCI COMPANY Ltd.
- 6.4.18 Reliance Industries Limited
- 6.4.19 SABIC
- 6.4.20 Shell plc
- 6.4.21 S-OIL CORPORATION
- 6.4.22 TotalEnergies
- 6.4.23 YEOCHUN NCC CO., LTD.
7 Market Opportunities and Future Outlook
- 7.1 White-space and Unmet-need Assessment

