
PUBLISHER: Mordor Intelligence | PRODUCT CODE: 1937413

PUBLISHER: Mordor Intelligence | PRODUCT CODE: 1937413
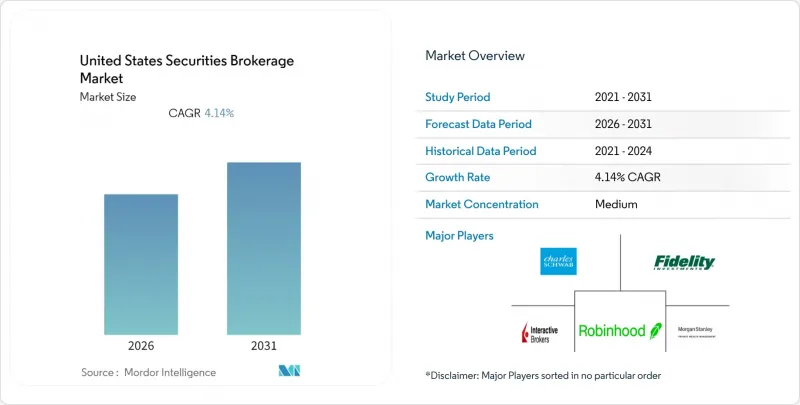
United States Securities Brokerage - Market Share Analysis, Industry Trends & Statistics, Growth Forecasts (2026 - 2031)
The United States securities brokerage market is expected to register a CAGR of 4.14% during the forecast period.
Momentum stems from the May 2024 shift to a T+1 settlement cycle that forced sizable modernization of post-trade infrastructure, while the sector simultaneously adapts to the zero-commission pricing model that took hold after 2019 . Persistent retail participation, broadening asset-class access through fractional trading, and demographic migration toward high-growth states reinforce revenue opportunities despite compressed core spreads. Firms continue reallocating capital toward cybersecurity, regulatory technology, and artificial-intelligence-enabled analytics to meet SEC Regulation Best Interest requirements and to personalize client engagement. Competitive intensity remains elevated as scale players pursue acquisitions to defray compliance costs and smaller brokers seek differentiation in embedded-finance partnerships. Against this backdrop, strategic focus centers on revenue diversification, risk management around margin lending, and maintaining technological resilience in the face of rising cyber threats.
United States Securities Brokerage Market Trends and Insights
Heightened Retail Participation Post-Zero-Commission Shift
The industry-wide elimination of trading commissions has permanently altered revenue mechanics, shifting emphasis toward payment-for-order-flow income, securities lending, and cash-sweep balances. Retail trading volumes in 2024 stood 40% above pre-pandemic levels, underlining how lowered costs broadened market access . Platforms now incorporate gamified interfaces, community forums, and bite-sized educational modules to keep engagement high and order flow predictable, yet these techniques invite regulatory scrutiny under evolving digital-engagement guidelines. Dependency on market volatility makes quarterly earnings more sensitive to trading frequency than to traditional asset-based fees, compelling brokers to diversify into advisory add-ons such as subscription research, tax-loss harvesting, and margin lending. Fractional-share execution has expanded participation in high-priced equities, while broadened options access has attracted younger investors pursuing leveraged strategies. Sustaining this momentum hinges on balancing engagement tactics with investor-protection mandates that continue to tighten under the SEC's 2025 examination priorities.
Accelerated Digitization of Clearing & Settlement
The compression from T+2 to T+1 settlement, effective May 2024, required sweeping upgrades in middle- and back-office workflows, from trade matching through funding and reconciliation . Cloud-native systems, robotic process automation, and artificial-intelligence monitoring have become standard as brokers chase latency reduction and real-time risk visibility. Initial implementation spending exceeded USD 2 billion industry-wide, and recurring maintenance costs now alter fixed-cost structures in favor of large firms that can amortize spend across vast transaction bases. Smaller brokers, already grappling with zero-commission revenue compression, face strategic crossroads between capitulation to consolidators and niche specialization where scale is less critical. The shift simultaneously elevates the cybersecurity threat surface because faster processing leaves limited time for manual exception handling; consequently, brokers have prioritized zero-trust architectures and continuous penetration testing to safeguard client assets. Real-time data architectures also enable personalized dashboards, enhancing client transparency and satisfaction in a market where experience increasingly differentiates providers.
Margin-Loan Exposure Amid Rising Rate Volatility
Rapid shifts in Federal Reserve policy have increased funding costs and heightened default probabilities within leveraged retail books, challenging brokers that rely on margin lending for ancillary income . Margin debt now stands near historical highs, amplifying liquidation cascades during equity drawdowns and exposing brokers to capital remediation calls. To mitigate risk, platforms have tightened eligibility criteria, raised maintenance requirements, and enhanced real-time stress testing, actions that dampen leverage-driven trading revenues. Basel III capital rules compound these pressures by mandating higher buffers against unsecured exposures, pushing smaller providers to curtail lending programs altogether. For investors, higher financing rates reduce strategy appeal, further suppressing turnover. Over the next two years, effective risk management of margin books will be a primary determinant of earnings stability for firms with heavy retail footprints.
Other drivers and restraints analyzed in the detailed report include:
- SEC Regulation Best Interest Advisory Upgrades
- Tokenization and Fractional Trading Expansion
- Cyber-Security Spend Escalation Compressing Margins
For complete list of drivers and restraints, kindly check the Table Of Contents.
Segment Analysis
Derivatives trading captured 8.85% CAGR momentum and continues to outpace other asset classes as institutional hedging demand intersects with retail enthusiasm for simplified options strategies. Stocks remained the largest component with a 45.89% share in 2025, buoyed by fractional trading and sustained corporate earnings visibility that appeals to mass-market investors. Exchange-traded funds and mutual funds jointly held 29.35%, reflecting a persistent appetite for broad diversification at low management fees. Bonds contributed 12.35%, a proportion pressured by volatile yields yet underpinned by institutional allocations to fixed-income ladders for duration management. Treasury notes added a 3.05% silver, serving primarily collateral and cash-management functions. Regulatory emphasis on transparency for complex instruments has encouraged platforms to offer robust risk-disclosure tools and scenario analysis, enhancing investor confidence without stifling activity. Continued innovation in pricing algorithms and real-time margin engines should reinforce derivatives' share, provided risk controls keep pace with user adoption.
Market depth and liquidity enhancements, notably through sophisticated market-making algorithms, have reduced bid-ask spreads and attracted larger institutional block orders, further legitimizing derivative markets within the United States securities brokerage market. Higher granularity in contract specifications, such as weekly expiries and mini contracts, allows investors to tailor exposures precisely, augmenting product stickiness. The United States securities brokerage market size for derivatives also benefits from cross-margin efficiencies that incentivize multi-asset participation on single platforms. However, liquidity clustering around popular strikes raises tail-risk concerns during high-volatility episodes, compelling brokers to maintain dynamic hedging programs. Compliance monitoring has grown equally intricate, with surveillance systems flagging potential market-manipulation patterns in real time. As retail literacy improves through educational content, derivatives are likely to stabilize as a mainstream asset class rather than remain a niche leveraged play.
Forex services represent the most vigorous growth segment at a 7.65% CAGR, driven by always-open markets, rising cross-border e-commerce, and investors seeking hedges against inflationary currency shifts. Stock brokerage retained 40.64% of 2025 revenues yet faces slower expansion due to maturing zero-commission competition and heightened focus on execution quality over price. Insurance-linked brokerage accounted for 22.55%, supported by integrated wealth-protection strategies that resonate with aging demographics. Real-estate brokerage carved out 14.25%, leveraging fractional property platforms that lower entry thresholds for younger investors. Mortgage brokerage stood at 8.55%, while niche commodities desks and specialty products collectively filled remaining share. Integration of services within banking super-apps has blurred category lines, enabling clients to toggle seamlessly between savings, trading, and insurance modules in a single interface.
Digital onboarding and straight-through processing have compressed account-opening times, making forex particularly attractive to new entrants exploring alternative asset classes. Variable-spread models, negative-balance protection, and micro-lot offerings democratize participation and insulate novice traders from catastrophic loss, fostering retention. Meanwhile, institutional clients benefit from enhanced liquidity pools and algorithmic execution, expanding brokerage take-rates through volume-based rebates. Compliance demands from the CFTC and international counterparts require jurisdiction-specific disclosures, urging brokers to invest in scalable rule engines. Service convergence also fuels data-monetization strategies; cross-selling analytics and back-office outsourcing bolster margins that pure transaction revenue can no longer sustain. Collectively, these dynamics confirm forex's stature as the leading growth lever within the broader United States securities brokerage market.
The United States Securities Brokerage Market Report Segments the Industry Into by Type (Derivatives & Commodities Brokerage, Stock Exchanges, Bonds Brokerage, Equities Brokerage, Other Types), by Mode (Online, Offline), and by Type of Establishment (Exclusive Brokers, Banks, Investment Firms, Other Types of Establishments). Get Five Years of Historical Data Alongside Five-Year Market Forecasts.
List of Companies Covered in this Report:
- Charles Schwab
- Fidelity Investments
- Robinhood Markets
- Interactive Brokers
- Morgan Stanley Wealth Management
- TD Ameritrade
- E*TRADE
- Merrill Edge
- Vanguard Brokerage Services
- J.P. Morgan Securities
- Wells Fargo Advisors
- Raymond James
- LPL Financial
- Edward Jones
- UBS Financial Services
- Stifel Nicolaus
- State Street Global Markets
- Citi Personal Wealth Management
- Goldman Sachs & Co.
- Credit Suisse Securities (USA)
- RBC Capital Markets
Additional Benefits:
- The market estimate (ME) sheet in Excel format
- 3 months of analyst support
TABLE OF CONTENTS
1 Introduction
- 1.1 Study Assumptions & Market Definition
- 1.2 Scope of the Study
2 Research Methodology
3 Executive Summary
4 Market Landscape
- 4.1 Market Overview
- 4.2 Market Drivers
- 4.2.1 Heightened retail participation post-zero-commission shift
- 4.2.2 Accelerated digitization of back-office clearing & settlement
- 4.2.3 SEC Regulation Best Interest pushing advisory upgrades
- 4.2.4 Tokenization of traditional assets enabling fractional trading (under-reported)
- 4.2.5 Adoption of AI-driven investor analytics for hyper-personalization (under-reported)
- 4.2.6 Banks' embedded-brokerage offerings within super-apps (under-reported)
- 4.3 Market Restraints
- 4.3.1 Margin-loan exposure amid rising rate volatility
- 4.3.2 Cyber-security spend escalation compressing margins
- 4.3.3 Consolidation-driven price wars eroding commission revenue
- 4.3.4 Potential SEC payment-for-order-flow ban (under-reported)
- 4.4 Value / Supply-Chain Analysis
- 4.5 Regulatory Landscape
- 4.6 Technological Outlook
- 4.7 Porter's Five Forces
- 4.7.1 Bargaining Power of Buyers
- 4.7.2 Bargaining Power of Suppliers
- 4.7.3 Threat of New Entrants
- 4.7.4 Threat of Substitutes
- 4.7.5 Competitive Rivalry
5 Market Size & Growth Forecasts (Value, USD Billion)
- 5.1 By Type of Security
- 5.1.1 Bonds
- 5.1.2 Stocks
- 5.1.3 Treasury Notes
- 5.1.4 Derivatives
- 5.1.5 Others (ETFs, Mutual Funds)
- 5.2 By Type of Brokerage Service
- 5.2.1 Stock
- 5.2.2 Insurance
- 5.2.3 Mortgage
- 5.2.4 Real Estate
- 5.2.5 Forex
- 5.2.6 Leasing
- 5.2.7 Others (Commodities)
- 5.3 By Type of Service
- 5.3.1 Full-Service
- 5.3.2 Discount
- 5.3.3 Online
- 5.3.4 Robo Advisor
- 5.3.5 Broker-Dealers
- 5.4 By Client Type
- 5.4.1 Retail
- 5.4.2 High Net Worth Individuals
- 5.4.3 Institutional
- 5.4.4 Small & Mid-Sized Enterprises
- 5.5 By Geography
- 5.5.1 Northeast
- 5.5.2 Midwest
- 5.5.3 South
- 5.5.4 West
6 Competitive Landscape
- 6.1 Market Concentration
- 6.2 Strategic Moves
- 6.3 Market Share Analysis
- 6.4 Company Profiles (includes Global level Overview, Market level overview, Core Segments, Financials as available, Strategic Information, Market Rank/Share for key companies, Products & Services, and Recent Developments)
- 6.4.1 Charles Schwab
- 6.4.2 Fidelity Investments
- 6.4.3 Robinhood Markets
- 6.4.4 Interactive Brokers
- 6.4.5 Morgan Stanley Wealth Management
- 6.4.6 TD Ameritrade
- 6.4.7 E*TRADE
- 6.4.8 Merrill Edge
- 6.4.9 Vanguard Brokerage Services
- 6.4.10 J.P. Morgan Securities
- 6.4.11 Wells Fargo Advisors
- 6.4.12 Raymond James
- 6.4.13 LPL Financial
- 6.4.14 Edward Jones
- 6.4.15 UBS Financial Services
- 6.4.16 Stifel Nicolaus
- 6.4.17 State Street Global Markets
- 6.4.18 Citi Personal Wealth Management
- 6.4.19 Goldman Sachs & Co.
- 6.4.20 Credit Suisse Securities (USA)
- 6.4.21 RBC Capital Markets
7 Market Opportunities & Future Outlook
- 7.1 Direct indexing adoption among mass-affluent investors
- 7.2 ESG & impact-focused brokerage platforms for Gen Z

