
PUBLISHER: Mordor Intelligence | PRODUCT CODE: 1937415

PUBLISHER: Mordor Intelligence | PRODUCT CODE: 1937415
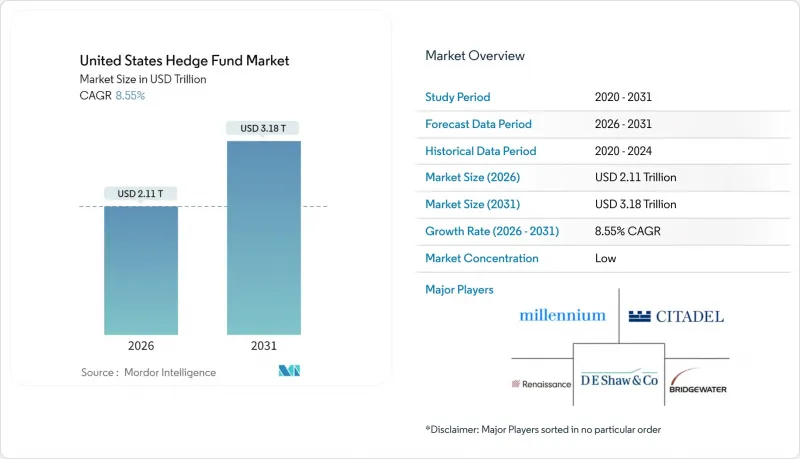
United States Hedge Fund - Market Share Analysis, Industry Trends & Statistics, Growth Forecasts (2026 - 2031)
The United States hedge fund market is expected to grow from USD 1.94 trillion in 2025 to USD 2.11 trillion in 2026 and is forecast to reach USD 3.18 trillion by 2031 at 8.55% CAGR over 2026-2031.
Elevated Treasury-SOFR spreads, wide policy-rate differentials, and persistent 60/40 portfolio correlation spikes are reinforcing institutional appetite for uncorrelated alpha that systematic and multi-manager platforms continue to harvest. Equity strategies still dominate aggregate allocations, yet macro and relative-value approaches are moving faster as dispersion-friendly rotations and rate volatility enlarge profit pools. Meanwhile, rapid digital transformation is pushing firms to license alternative data and deploy AI-driven engines despite rising operating costs that weigh most heavily on sub-USD 1 billion managers. Competitive intensity is widening as well-capitalized platforms poach talent, and regulatory changes such as enhanced Form PF disclosures push all players toward simpler, performance-linked fee structures. Last, regional migration toward lower-cost hubs in Florida and Texas is accelerating, giving the South an outsized growth edge even as New York preserves its unrivaled deal-making ecosystem.
United States Hedge Fund Market Trends and Insights
Institutional Appetite for Uncorrelated Alpha
Institutional investors such as public pension funds and university endowments are boosting allocations to hedge funds that post negative correlations to broad equity and bond benchmarks. CalPERS, for example, raised its hedge-fund sleeve by 15% in 2024 after managers produced positive returns during the March volatility window. The move reflected a broader view that the traditional 60/40 model no longer provides adequate downside buffering when both asset classes sell off together. Endowments also increased macro exposures that historically trade through currency and rate instruments unlinked to core equity risk. Consultants now emphasize dispersion-driven returns, instructing clients to view absolute-return mandates as permanent rather than tactical. Taken together, the growing pension pipeline indicates persistent support for the United States hedge fund market well into the medium term.
High United States Policy-Rate Spread Widening RV Trades
A sustained gap between policy rates and secured overnight financing costs has created rich basis trades for fixed-income specialists. Treasury-SOFR spreads averaged 47 basis points during 2024, roughly double the 2019-2021 regime, providing a dependable funding cushion for systematic carry desks. Multi-manager shops deploy capital across relative-value pods that arbitrage these distortions without assuming directional rate bets. Banks' balance-sheet constraints reinforce the anomaly by capping repo supply, thereby allowing hedge funds to capture excess yields. The strategy's scalability attracts inflows because large positions can be recycled across various maturities. As long as quantitative tightening persists, the spread environment is expected to remain supportive through at least 2026.
Rising Technology & Data-Licensing Costs
Licensed satellite-magery feeds, credit-card exhaust, and geolocation streams now underpin most systematic engines, but subscription fees are climbing quickly. Bloomberg estimates that mid-sized hedge funds spent an average of USD 2.4 million on alternative data in 2024, triple 2019 levels. Firms also commit multimillion-dollar capex budgets to GPU-rich clusters needed for deep-learning models, locking up capital that could otherwise support trading activity. Aggregated technology overhead rose 31% year-over-year, meaning smaller managers pay a higher share of gross revenue to stay competitive. Limited partners tolerate the expense only if net alpha persists, yet fee caps restrict pass-through flexibility. Cost pressures therefore represent a structural headwind, especially for emerging United States hedge fund market entrants.
Other drivers and restraints analyzed in the detailed report include:
- Dispersion-Friendly Equity Micro-Sector Rotation
- SEC Private-Fund Fee-Transparency Rules
- Greater Treasury-Clearing Margin Requirements
For complete list of drivers and restraints, kindly check the Table Of Contents.
Segment Analysis
The equity bucket accounted for a 38.22% share of the United States hedge fund market in 2025, maintaining primacy despite an increasingly favorable backdrop for macro funds. Macro strategies, though smaller in absolute dollars, are forecast to enjoy the highest 8.63% CAGR because volatility in currency and rate curves offers scalable, capital-efficient trades that meet institutional diversification demands. Within equities, dispersion-driven long/short books exploiting AI winners and legacy laggards outperformed broad index beta, keeping client trust even as fee pressure rises. Event-driven vehicles secured an 18.15% slice, buoyed by elevated merger-arbitrage pipelines in the technology supply chain. Credit funds grew to 14.62% as refinancing risk climbed and commercial real-estate distress surfaced, presenting fertile hunting grounds. Relative-value desks hold 11.95% but face yield-spread compression that tempts capital rotation toward macro. Crypto-focused niche funds lifted quickly to 3.38% from a small base, yet institutional skepticism about custody persists.
Macro acceleration rests on policy divergence among global central banks, boosting relative-rate bets and FX volatility even while overall growth expectations moderate. Managers lever cross-asset correlation breakdowns between fixed income and commodities, whereas equity long/short desks double down on sector rotation. Multi-strategy complexes, holding 11.76%, continue to ingest smaller teams and distribute risk budgets to stand-alone pods, streamlining due diligence for limited partners. The United States hedge fund market size attached to multi-strategy mandates is projected to climb at 6.95% through 2031 as one-stop-shop convenience outweighs marginally higher aggregate fees. Meanwhile, SEC short-position transparency, effective July 2025, could alter liquidity dynamics for high-short-interest equities, adding a new wrinkle for crowded trades. Strategy diversification, therefore, remains paramount for managers looking to smooth cross-cycle returns.
Additional Benefits:
- The market estimate (ME) sheet in Excel format
- 3 months of analyst support
TABLE OF CONTENTS
1 Introduction
- 1.1 Study Assumptions & Market Definition
- 1.2 Scope of the Study
2 Research Methodology
3 Executive Summary
4 Market Landscape
- 4.1 Market Overview
- 4.2 Market Drivers
- 4.2.1 Institutional appetite for uncorrelated alpha
- 4.2.2 High United States policy-rate spread widening RV trades
- 4.2.3 Dispersion-friendly equity micro-sector rotation
- 4.2.4 SEC private-fund fee-transparency rules
- 4.2.5 Crowding & capacity pressure in multi-PM pods
- 4.2.6 Talent migration to private-credit platforms
- 4.3 Market Restraints
- 4.3.1 Rising technology & data-licensing costs
- 4.3.2 Greater Treasury-clearing margin requirements
- 4.3.3 Retail redemption spikes in risk-off shocks
- 4.3.4 Compressed equity long/short fee budgets
- 4.4 Value / Supply-Chain Analysis
- 4.5 Regulatory Landscape
- 4.6 Technological Outlook
- 4.7 Porter's Five Forces
- 4.7.1 Threat of New Entrants
- 4.7.2 Bargaining Power of Investors
- 4.7.3 Bargaining Power of Fund Service Providers
- 4.7.4 Threat of Substitutes (Private Credit, ETFs)
- 4.7.5 Competitive Rivalry
5 Market Size & Growth Forecasts (Value, 2020-2030E)
- 5.1 By Core Investment Strategy
- 5.1.1 Equity Strategies
- 5.1.2 Macro Strategies
- 5.1.3 Event-driven Strategies
- 5.1.4 Credit Strategies
- 5.1.5 Relative Value Strategies
- 5.1.6 Niche Strategies
- 5.1.7 Multi-strategy
- 5.1.8 Others
- 5.2 By Fund Size
- 5.2.1 Large (>USD 5 billion)
- 5.2.2 Medium (USD 1-5 billion)
- 5.2.3 Small (<USD 1 billion)
- 5.3 By Investor Type
- 5.3.1 Institutional Investors
- 5.3.2 Family Offices
- 5.3.3 High-Net-Worth Individuals
- 5.3.4 Retail Liquid Alternatives
- 5.4 By Geography
- 5.4.1 Northeast
- 5.4.2 Midwest
- 5.4.3 South
- 5.4.4 West
6 Competitive Landscape
- 6.1 Market Concentration
- 6.2 Strategic Moves
- 6.3 Market Share Analysis
- 6.4 Company Profiles (includes Global level Overview, Market level overview, Core Segments, Financials as available, Strategic Information, Market Rank/Share for key companies, Products & Services, and Recent Developments)
- 6.4.1 Bridgewater Associates
- 6.4.2 Citadel LLC
- 6.4.3 Millennium Management
- 6.4.4 Renaissance Technologies
- 6.4.5 Two Sigma Investments
- 6.4.6 DE Shaw & Co.
- 6.4.7 AQR Capital Management
- 6.4.8 Point72 Asset Management
- 6.4.9 Elliott Management
- 6.4.10 Viking Global Investors
- 6.4.11 Baupost Group
- 6.4.12 Third Point
- 6.4.13 Pershing Square Capital
- 6.4.14 Hudson Bay Capital
- 6.4.15 Farallon Capital
- 6.4.16 Tiger Global Management
- 6.4.17 Coatue Management
- 6.4.18 Appaloosa Management
- 6.4.19 Sculptor Capital Management
- 6.4.20 Canyon Partners
7 Market Opportunities & Future Outlook
- 7.1 Secondary-risk transfer mandates from insurers
- 7.2 AI-driven systematic micro-alpha extraction

