
PUBLISHER: Mordor Intelligence | PRODUCT CODE: 1937434

PUBLISHER: Mordor Intelligence | PRODUCT CODE: 1937434
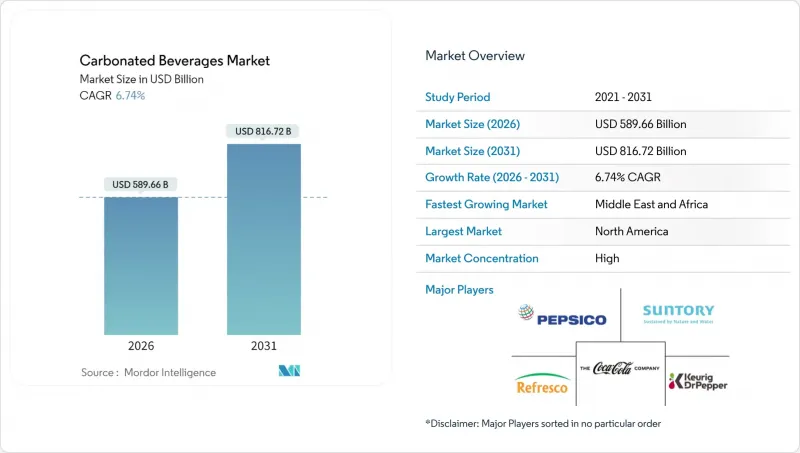
Carbonated Beverages - Market Share Analysis, Industry Trends & Statistics, Growth Forecasts (2026 - 2031)
The carbonated beverages market was valued at USD 552.41 billion in 2025 and estimated to grow from USD 589.66 billion in 2026 to reach USD 816.72 billion by 2031, at a CAGR of 6.74% during the forecast period (2026-2031).
Despite growing health concerns, the market continues to expand. This growth is driven by premium, functional, and artisanal products that command higher prices, balancing out stagnant sales of traditional colas. Carbonated sports and energy drinks are leading the market due to their caffeine and electrolyte content, which appeals to consumers with active lifestyles. Aseptic packaging is also contributing to growth by reducing carbon footprints and improving access in rural areas. Additionally, direct-to-consumer models are simplifying the supply chain. Major companies are maintaining their market share by introducing sugar-free options and acquiring smaller businesses. At the same time, start-ups are finding success with innovations like plant-based sweeteners and carbonation using real fruit.
Global Carbonated Beverages Market Trends and Insights
Product Innovation in Flavors and Formats
Flavor diversification is drawing in consumers who are bored with traditional cola and lemon-lime flavors. In February 2024, The Coca-Cola Company introduced Coca-Cola Spiced, a mix of raspberry and spice, aimed at younger consumers seeking unique options. Similarly, PepsiCo expanded its Bubly Burst line by adding caffeinated versions to compete in the functional refreshment market. Newer brands are focusing on wellness-oriented products: NO CAP! launched a prebiotic soda with 5 grams of fiber per can, Bloom Pop introduced collagen-infused drinks promoting skin health, and Mighty Pop included adaptogens like ashwagandha to help manage stress. These products are priced 30% to 50% higher than regular sodas but appeal to consumers who view them as functional supplements rather than just beverages. Japan's Coca-Cola Plus, fortified with indigestible dextrin fiber, demonstrates how regulatory approval for health claims can help products stand out in crowded markets. The increasing use of at-home carbonation systems, such as SodaStream and Aarke, shows a shift toward customizable flavors and reduced single-use packaging, which appeals to environmentally conscious households.
Rise of Health-Oriented Formulations
Zero-sugar and reduced-calorie options are now essential for brands to stay relevant, as evidence linking added sugars to metabolic disorders continues to grow. The World Health Organization recommends keeping free sugar intake below 10% of total energy consumption, prompting many brands to reformulate their products. In North America, Zevia, which uses stevia as a sweetener, has experienced strong growth in retail markets. Similarly, Chi Forest in China has gained market share with erythritol-based products that provide sweetness without affecting blood sugar levels. However, natural sweeteners come with challenges. Stevia has a licorice-like aftertaste, and erythritol creates a cooling sensation, often requiring masking agents or blending with other non-nutritive sweeteners. Despite these issues, improved taste profiles are driving greater consumer acceptance. Additionally, brands are adding functional ingredients like electrolytes in sports drinks, probiotics for gut health, and vitamins for immunity. These features help position products as health-focused rather than indulgent, allowing brands to charge premium prices and reduce the impact of sugar taxes.
Health Consciousness and Sugar Aversion
Growing evidence shows that consuming too much sugar is linked to obesity, type 2 diabetes, and heart disease. As a result, more consumers are checking nutrition labels and cutting back on extra calories. Public health campaigns and media coverage have raised awareness about added sugars, leading people to choose unsweetened or lightly sweetened options like flavored sparkling water and kombucha. This trend is most noticeable among health-conscious groups, such as fitness enthusiasts, parents of young children, and individuals managing chronic health issues, who see traditional soft drinks as unsuitable for their wellness goals. To meet this demand, brands are expanding their zero-sugar product lines. However, matching the taste of sugary drinks remains a challenge for some products. Additionally, even though artificial sweeteners like aspartame and sucralose are approved by the U.S. Food and Drug Administration in 2024 and the European Food Safety Authority, many consumers remain skeptical about them. Companies also face challenges due to varying consumer preferences. Some people focus on reducing calories, others prefer natural ingredients, and some want both. This forces companies to manage multiple product variations, which adds pressure to their production and inventory systems.
Other drivers and restraints analyzed in the detailed report include:
- Faster-Paced City Living Boosts Need for Convenient, Portable Beverages
- Premiumization and Artisanal Offerings
- Stringent Sugar Regulations and Taxes
For complete list of drivers and restraints, kindly check the Table Of Contents.
Segment Analysis
In 2025, carbonated soft drinks accounted for 59.62% of the market share, driven by The Coca-Cola Company and PepsiCo. These well-established brands benefit from extensive distribution networks in over 200 countries and strong consumer loyalty built over generations. However, increasing health awareness in developed markets is reducing per-capita consumption. To address this, brands are focusing on zero-sugar variants, which are becoming a larger part of cola sales. In the United Kingdom, the Soft Drinks Industry Levy led to a 40% reduction in sugar content in carbonated soft drinks, showing how government policies can encourage reformulation and shift consumer preferences toward lower-calorie options. In Japan, Coca-Cola Plus, which contains indigestible dextrin fiber and is approved for health claims by regulators, highlights how functional ingredients can refresh traditional cola products in mature markets where differentiation is essential.
Carbonated sports and energy drinks are expected to grow at a 7.62% CAGR through 2031, making them the fastest-growing product category. Consumers increasingly see these drinks as performance enhancers rather than occasional treats. These beverages are now being consumed in new situations, such as during morning commutes as coffee alternatives, before workouts by fitness enthusiasts, and during late-night study sessions by students. This broader usage helps diversify revenue streams and reduces seasonal sales fluctuations. Brands are also offering different options, such as standard, extra strength, zero-sugar, and performance variants, to meet varying consumer needs and preferences. While some regions have introduced age-verification rules to address concerns about caffeine content for younger consumers, inconsistent enforcement has not significantly affected sales growth in major markets.
In 2025, the mass tier accounted for 74.55% of the market, driven by value-conscious consumers in emerging markets where affordability is key. Carbonated beverages, priced under USD 1 per serving, are popular as affordable treats. This segment thrives in convenience stores, supermarkets, and vending machines, supported by promotions like buy-one-get-one-free offers and multi-pack discounts that encourage impulse buying and repeat purchases. Private-label brands are gaining ground, especially in European chains like Aldi and Lidl, offering products 30% to 40% cheaper than national brands. This shift is weakening brand loyalty among price-sensitive shoppers. In developed markets, growth is limited by health trends and sugar taxes, but emerging regions in Asia-Pacific, the Middle East, and Africa continue to drive volume growth due to rising incomes and improved retail access. Brands are defending their position through localized production to reduce costs, aggressive marketing for better shelf placement, and diverse product portfolios to cater to different income groups.
Premium offerings are growing at a 7.18% CAGR through 2031, fueled by affluent urban consumers in North America, Western Europe, and Asia-Pacific. These consumers see carbonated beverages as lifestyle products rather than basic refreshments. Brands like Fever-Tree, priced over USD 2 per bottle, stand out by using natural ingredients sourced from specific regions, such as quinine from the Democratic Republic of Congo and ginger from Nigeria. The premium segment benefits from the recovery of bars and restaurants, where craft sodas and mixers are used in cocktails, often marked up by 200% to 300%. Brands like Fentimans and Q Mixers target consumers who value quality ingredients, such as cane sugar and natural flavors, and are willing to pay for craftsmanship. This segment is less affected by economic downturns, as its consumers are less price-sensitive. Premium products are also gaining shelf space in specialty stores and upscale foodservice outlets, meeting the demand for curated selections.
The Carbonated Beverages Market Report is Segmented by Product Type (Carbonated Soft Drinks, Carbonated Water, and More), Tier (Mass, Premium), Packaging Type (PET Bottles, Glass Bottles, Metal Can, Aseptic Packages), Distribution Channel (On-Trade, Off-Trade), and Geography (North America, Europe, Asia-Pacific, South America, Middle East and Africa). The Market Forecasts are Provided in Terms of Value (USD).
Geography Analysis
In 2025, North America held 46.90% of the market share, supported by strong consumption habits, advanced cold-chain systems, and high spending on convenience beverages. However, growth is slowing due to increasing health awareness and sugar-tax discussions in the United States and Canada. The region drives innovation, with brands testing new flavors, functional drinks, and sustainable packaging locally before global launches. In Mexico, despite a soda tax, consumption remains high, showing lower price sensitivity than expected. The tax has increased revenue and shifted some consumers to smaller pack sizes. Regulatory challenges are rising, with California's bottle deposit system and New York's proposed producer responsibility laws complicating compliance. The FDA's scrutiny of artificial sweeteners and caffeine in energy drinks may also require reformulations. The on-trade channel is recovering post-pandemic, with craft sodas and premium mixers gaining popularity in cocktails featuring local and artisanal ingredients.
The Middle East and Africa are expected to grow at a 8.98% CAGR through 2031, the fastest globally, driven by rising incomes, retail modernization, and young populations in GCC countries and urban areas of Nigeria, Kenya, and South Africa. Taxes on carbonated drinks in Saudi Arabia and the UAE have raised prices but increased demand for zero-sugar and functional beverages. Improved infrastructure, supermarket growth, and better e-commerce logistics are helping brands reach rural and peri-urban areas. However, political instability, currency fluctuations, and reliance on imported materials like aluminum cans and sweeteners pose risks, requiring local partnerships and hedging strategies. The region's hot climate ensures steady demand for chilled drinks, with Ramadan driving seasonal consumption spikes that challenge supply chains but offer revenue opportunities for agile brands.
Asia-Pacific markets are highly diverse. China's ready-to-drink beverage market is growing due to urbanization, rising incomes, and the expansion of convenience stores and vending machines in major cities. In India, a 40% goods and services tax limits affordability, but premiumization is evident in cities where affluent consumers prefer imported and functional drinks. Japan leads in innovation with products like Coca-Cola Plus, enriched with fiber and approved for health claims, appealing to older consumers focused on wellness. Southeast Asia, including Thailand, Indonesia, and Vietnam, is seeing rapid retail growth and middle-class expansion, creating opportunities for brands investing in local production and distribution. In Europe, Germany, France, and Spain are shifting to premium craft sodas and botanical sparkling waters, while Eastern Europe remains price-sensitive and volume-driven. In South America, economic challenges in Argentina and Brazil slow growth, but urbanization and retail modernization in Colombia and Chile create opportunities for localized strategies.
- The Coca-Cola Company
- PepsiCo, Inc.
- Keurig Dr Pepper Inc.
- National Beverage Corp.
- Refresco Group B.V.
- Suntory Beverage & Food Limited
- Asahi Group Holdings, Ltd.
- Britvic PLC
- A.G. Barr
- Red Bull GmbH
- Monster Beverage Corporation
- Fraser and Neave, Limited
- Parle Agro Pvt. Ltd.
- Grupo Jumex, S.A. de C.V.
- Arca Continental, S.A.B. de C.V.
- Jones Soda Co.
- Spindrift Beverage Co., Inc.
- Zevia PBC
- Polar Beverages, Inc.
- Reed's Inc.
Additional Benefits:
- The market estimate (ME) sheet in Excel format
- 3 months of analyst support
TABLE OF CONTENTS
1 INTRODUCTION
- 1.1 Study Assumptions and Market Definition
- 1.2 Scope of the Study
2 RESEARCH METHODOLOGY
3 EXECUTIVE SUMMARY
4 MARKET LANDSCAPE
- 4.1 Market Overview
- 4.2 Market Drivers
- 4.2.1 Product innovation in flavors and formats
- 4.2.2 Rise of health-oriented formulations
- 4.2.3 Faster-paced city living boosts need for convenient, portable beverages
- 4.2.4 Premiumization and artisanal offerings
- 4.2.5 Proliferation of e-commerce, convenience stores, and organized retail
- 4.2.6 Aggressive campaigns, social media engagement, and celebrity endorsements
- 4.3 Market Restraints
- 4.3.1 Health consciousness and sugar aversion
- 4.3.2 Stringent sugar regulations and taxes
- 4.3.3 Intense competition from healthier beverages
- 4.3.4 Supply chain disruptions for ingredients
- 4.4 Supply-Chain Analysis
- 4.5 Regulatory Landscape
- 4.6 Technological Outlook
- 4.7 Porter's Five Forces Analysis
- 4.7.1 Threat of New Entrants
- 4.7.2 Bargaining Power of Buyers
- 4.7.3 Bargaining Power of Suppliers
- 4.7.4 Threat of Substitutes
- 4.7.5 Intensity of Competitive Rivalry
5 MARKET SIZE AND GROWTH FORECASTS (VALUE)
- 5.1 By Product Type
- 5.1.1 Carbonated Soft Drinks
- 5.1.2 Carbonated Water
- 5.1.3 Carbonated Sports and Energy Drinks
- 5.1.4 Others
- 5.2 By Tier
- 5.2.1 Mass
- 5.2.2 Premium
- 5.3 By Packaging Type
- 5.3.1 PET Bottles
- 5.3.2 Glass Bottles
- 5.3.3 Metal Can
- 5.3.4 Aseptic packages (tetra pak, cartons, pouches)
- 5.4 By Distribution Channel
- 5.4.1 On-Trade
- 5.4.2 Off-Trade
- 5.4.2.1 Supermarket/Hypermarket
- 5.4.2.2 Convenience Stores
- 5.4.2.3 Specialty Stores
- 5.4.2.4 Online Retail
- 5.4.2.5 Other Distribution Channels
- 5.5 By Geography
- 5.5.1 North America
- 5.5.1.1 United States
- 5.5.1.2 Canada
- 5.5.1.3 Mexico
- 5.5.1.4 Rest of North America
- 5.5.2 Europe
- 5.5.2.1 Germany
- 5.5.2.2 United Kingdom
- 5.5.2.3 Italy
- 5.5.2.4 France
- 5.5.2.5 Spain
- 5.5.2.6 Netherlands
- 5.5.2.7 Poland
- 5.5.2.8 Belgium
- 5.5.2.9 Sweden
- 5.5.2.10 Rest of Europe
- 5.5.3 Asia-Pacific
- 5.5.3.1 China
- 5.5.3.2 India
- 5.5.3.3 Japan
- 5.5.3.4 Australia
- 5.5.3.5 Indonesia
- 5.5.3.6 South Korea
- 5.5.3.7 Thailand
- 5.5.3.8 Singapore
- 5.5.3.9 Rest of Asia-Pacific
- 5.5.4 South America
- 5.5.4.1 Brazil
- 5.5.4.2 Argentina
- 5.5.4.3 Colombia
- 5.5.4.4 Chile
- 5.5.4.5 Peru
- 5.5.4.6 Rest of South America
- 5.5.5 Middle East and Africa
- 5.5.5.1 South Africa
- 5.5.5.2 Saudi Arabia
- 5.5.5.3 United Arab Emirates
- 5.5.5.4 Nigeria
- 5.5.5.5 Egypt
- 5.5.5.6 Morocco
- 5.5.5.7 Turkey
- 5.5.5.8 Rest of Middle East and Africa
- 5.5.1 North America
6 COMPETITIVE LANDSCAPE
- 6.1 Market Concentration
- 6.2 Strategic Moves
- 6.3 Market Share Analysis
- 6.4 Company Profiles (includes Global level Overview, Market level overview, Core Segments, Financials as available, Strategic Information, Market Rank/Share for key companies, Products and Services, and Recent Developments)
- 6.4.1 The Coca-Cola Company
- 6.4.2 PepsiCo, Inc.
- 6.4.3 Keurig Dr Pepper Inc.
- 6.4.4 National Beverage Corp.
- 6.4.5 Refresco Group B.V.
- 6.4.6 Suntory Beverage & Food Limited
- 6.4.7 Asahi Group Holdings, Ltd.
- 6.4.8 Britvic PLC
- 6.4.9 A.G. Barr
- 6.4.10 Red Bull GmbH
- 6.4.11 Monster Beverage Corporation
- 6.4.12 Fraser and Neave, Limited
- 6.4.13 Parle Agro Pvt. Ltd.
- 6.4.14 Grupo Jumex, S.A. de C.V.
- 6.4.15 Arca Continental, S.A.B. de C.V.
- 6.4.16 Jones Soda Co.
- 6.4.17 Spindrift Beverage Co., Inc.
- 6.4.18 Zevia PBC
- 6.4.19 Polar Beverages, Inc.
- 6.4.20 Reed's Inc.
7 MARKET OPPORTUNITIES AND FUTURE OUTLOOK

