
PUBLISHER: Mordor Intelligence | PRODUCT CODE: 1939117

PUBLISHER: Mordor Intelligence | PRODUCT CODE: 1939117
Terahertz Technologies - Market Share Analysis, Industry Trends & Statistics, Growth Forecasts (2026 - 2031)
The terahertz technologies market is expected to grow from USD 0.78 billion in 2025 to USD 0.89 billion in 2026 and is forecast to reach USD 1.77 billion by 2031 at 14.61% CAGR over 2026-2031.
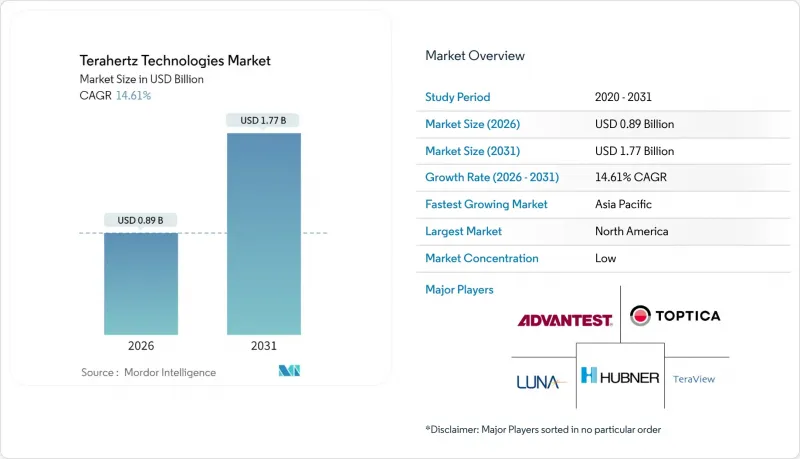
Breakthroughs in compact photonic-integrated sources, the expansion of 6G proof-of-concept backhaul links, and pharmaceutical companies' shift toward real-time inline quality control are accelerating commercialization. Mid-frequency systems (1-5 THz) sustain demand by balancing atmospheric transmission with imaging resolution, while high-frequency systems above 5 THz attract precision metrology and high-data-rate research. Healthcare remains the largest end user, yet telecommunications records the steepest growth as 6G spectrum strategies crystallize. Fragmentation persists because vendors specialize by vertical; value is migrating from discrete components to turnkey platforms with AI-driven analytics.
Global Terahertz Technologies Market Trends and Insights
Advances in compact photonic-integrated THz sources
Silicon photonics has shrunk terahertz engines, eliminating bulky cryocoolers and cutting the footprint by 75% relative to discrete architectures. TOPTICA demonstrated monolithic quantum-cascade-laser integration delivering >10 mW/cm2 at room temperature up to 3 THz, opening mass-manufacturing pathways that can slash per-unit costs by an order of magnitude within the outlook period.
Surge in 6G backhaul proof-of-concept installations
NTT DOCOMO and Fujitsu achieved 100 Gbps over 1 km at 300 GHz in urban trials in 2024, validating the feasibility of terahertz technology for dense small-cell topologies. Samsung logged similar data rates while lowering power consumption by 40% compared to millimeter-wave alternatives.
Limited atmospheric transmission windows constrain outdoor links
Water-vapor absorption imposes 100 dB/km losses outside narrow bands near 220 GHz, 340 GHz, and 650 GHz, forcing precise frequency control and restricting outdoor spans to short ranges or controlled climates.
Other drivers and restraints analyzed in the detailed report include:
- Rising adoption in inline pharmaceutical QA/QC
- Defense demand for millimeter-resolution passive standoff scanners
- Cryogenic cooling requirements for high-power QCL sources
For complete list of drivers and restraints, kindly check the Table Of Contents.
Segment Analysis
Terahertz imaging retained 41.32% of the terahertz technology market in 2025 as pharmaceutical, security, and non-destructive testing installations matured. Communication platforms contribute modest revenue today, yet are set to expand fastest at 15.46% CAGR as 6G architectures formalize. Robust defect-detection accuracy-99.8% in Roche's coating inspections-underpins imaging's premium value proposition, whereas communications hinge on standard-setting milestones.
Demand patterns show early adopters capitalizing on established ROI for imaging, while network operators trial multi-gigabit links to offload fiber in dense urban grids. Hardware vendors bundle AI-enabled analytics, easing integration into pharmaceutical MES or telecom orchestration stacks, thereby shifting revenue toward software subscriptions that monetize performance data.
Platforms operating 1-5 THz commanded 38.20% of the terahertz technologies market share in 2025 thanks to favorable transmission-to-resolution ratios. High-band (>5 THz) systems, though nascent, should log 15.81% CAGR as frequency-multiplier chains mature beyond 6 THz. Solid-state multipliers from Virginia Diodes now deliver stable output enabling nanometer-precision metrology, broadening addressable use cases.
Mid-band incumbency benefits from supply-chain maturity and lower component prices. High-band adoption will rise where extreme resolution unlocks new value, such as in semiconductor linewidth metrology, additive-manufactured lattice inspection, and quantum materials research, offsetting the higher optical-alignment complexity.
The Terahertz Technologies Market Report is Segmented by Application Category (Terahertz Imaging Systems, and More), Frequency Range (Low-Frequency Terahertz, and More), End User (Healthcare, Defense and Security, and More), Component Type (Terahertz Sources, Terahertz Detectors, and More), and Geography. The Market Forecasts are Provided in Terms of Value (USD).
Geography Analysis
North America secured 34.45% market share in 2025, propelled by USD 150 million federal research grants, defense procurement of standoff scanners, and pharmaceutical incumbents seeking PAT compliance. Academic-industry consortia accelerate commercialization through shared clean-room facilities and IP pools, shortening concept-to-pilot cycles for start-ups. Canadian mining and pulp-and-paper sectors integrate ruggedized THz imagers for remote ore and fiber-grade classification.
Asia-Pacific leads growth at 17.55% CAGR as Chinese operators earmark over USD 2 billion for terahertz 6G R&D and Japanese precision-tool vendors integrate mid-band probes into metrology benches. South Korea embeds THz analytics in EUV semiconductor fabs for die-bond uniformity checks, and Indian generics producers deploy inline spectrometers to meet export pharmacopeia standards. Robust government subsidies and domestic supply-chain scaling compress cost curves.
Europe charts steady uptake anchored in automotive lightweighting, pharmaceutical continuous manufacturing, and Horizon Europe R&D funding worth EUR 200 million (USD 214 million). German machine builders bundle terahertz transceivers into Industry 4.0 robotics, while Nordic aerospace firms use high-band imagers for composite delamination audits. Middle East energy companies pilot well-logging tools for hydrate mapping, and Brazilian agribusinesses trial handheld scanners for aflatoxin detection in corn exports.
- ADVANTEST Corporation
- Luna Innovations Incorporated
- TeraView Limited
- TOPTICA Photonics AG
- HUBNER GmbH and Co. KG
- BATOP GmbH
- Microtech Instruments Inc.
- Menlo Systems GmbH
- Gentec-EO Inc.
- Bakman Technologies LLC
- QMC Instruments Ltd
- Bruker Corporation
- Lytid SAS
- Attocube Systems AG
- Helmut Fischer GmbH
- Baugh and Weedon Ltd
- Das-nano S.L.
- Teravil Ltd
- Terasense Group Inc.
- Virginia Diodes Inc.
Additional Benefits:
- The market estimate (ME) sheet in Excel format
- 3 months of analyst support
TABLE OF CONTENTS
1 INTRODUCTION
- 1.1 Study Assumptions and Market Definition
- 1.2 Scope of the Study
2 RESEARCH METHODOLOGY
3 EXECUTIVE SUMMARY
4 MARKET LANDSCAPE
- 4.1 Market Overview
- 4.2 Market Drivers
- 4.2.1 Advances in compact photonic-integrated THz sources
- 4.2.2 Surge in 6G-backhaul proof-of-concept installations
- 4.2.3 Rising adoption in inline pharmaceutical QA/QC
- 4.2.4 Defense demand for mm-resolution passive standoff scanners
- 4.2.5 Accelerating deployment of MHz-repetition ultrafast laser-pumped THz systems
- 4.2.6 Government-funded astronomy payloads requiring cryogenic THz detectors
- 4.3 Market Restraints
- 4.3.1 Limited atmospheric transmission windows constrain outdoor links
- 4.3.2 Cryogenic cooling requirements for high-power QCL sources
- 4.3.3 Scarcity of volume-manufacturable low-loss THz packaging
- 4.3.4 Absence of harmonised global EMC/health exposure limits above 275 GHz
- 4.4 Industry Supply-Chain Analysis
- 4.5 Impact of Macroeconomic Factors
- 4.6 Regulatory Landscape
- 4.7 Technological Outlook
- 4.8 Porter's Five Forces Analysis
- 4.8.1 Bargaining Power of Suppliers
- 4.8.2 Bargaining Power of Buyers
- 4.8.3 Threat of New Entrants
- 4.8.4 Threat of Substitutes
- 4.8.5 Degree of Competition
- 4.9 Pricing Analysis
- 4.10 Analysis of Non-destructive Testing Applications of Terahertz Technology
- 4.11 Legal and Regulatory Space for Terahertz Technologies
5 MARKET SIZE AND GROWTH FORECASTS (VALUE)
- 5.1 By Application Category
- 5.1.1 Terahertz Imaging Systems
- 5.1.1.1 Active Systems
- 5.1.1.2 Passive Systems
- 5.1.2 Terahertz Spectroscopy Systems
- 5.1.2.1 Time-Domain
- 5.1.2.2 Frequency-Domain
- 5.1.3 Communication Systems
- 5.1.1 Terahertz Imaging Systems
- 5.2 By Frequency Range
- 5.2.1 Low-Frequency Terahertz (0.1 - 1 THz)
- 5.2.2 Mid-Frequency Terahertz (1 - 5 THz)
- 5.2.3 High-Frequency Terahertz (Above 5 THz)
- 5.3 By End User
- 5.3.1 Healthcare
- 5.3.2 Defense and Security
- 5.3.3 Telecommunications
- 5.3.4 Industrial
- 5.3.5 Food and Agriculture
- 5.3.6 Laboratories
- 5.3.7 Other End Users
- 5.4 By Component Type
- 5.4.1 Terahertz Sources
- 5.4.2 Terahertz Detectors
- 5.4.3 Optics and Passive Components
- 5.4.4 Systems and Software
- 5.5 By Geography
- 5.5.1 North America
- 5.5.1.1 United States
- 5.5.1.2 Canada
- 5.5.1.3 Mexico
- 5.5.2 South America
- 5.5.2.1 Brazil
- 5.5.2.2 Argentina
- 5.5.2.3 Rest of South America
- 5.5.3 Europe
- 5.5.3.1 Germany
- 5.5.3.2 United Kingdom
- 5.5.3.3 France
- 5.5.3.4 Italy
- 5.5.3.5 Spain
- 5.5.3.6 Rest of Europe
- 5.5.4 Asia-Pacific
- 5.5.4.1 China
- 5.5.4.2 Japan
- 5.5.4.3 India
- 5.5.4.4 South Korea
- 5.5.4.5 Rest of Asia-Pacific
- 5.5.5 Middle East and Africa
- 5.5.5.1 Middle East
- 5.5.5.1.1 Saudi Arabia
- 5.5.5.1.2 United Arab Emirates
- 5.5.5.1.3 Turkey
- 5.5.5.1.4 Rest of Middle East
- 5.5.5.2 Africa
- 5.5.5.2.1 South Africa
- 5.5.5.2.2 Nigeria
- 5.5.5.2.3 Rest of Africa
- 5.5.5.1 Middle East
- 5.5.1 North America
6 COMPETITIVE LANDSCAPE
- 6.1 Market Concentration
- 6.2 Strategic Moves
- 6.3 Market Share Analysis
- 6.4 Company Profiles (includes Global level Overview, Market level overview, Core Segments, Financials as available, Strategic Information, Market Rank/Share for key companies, Products and Services, and Recent Developments)
- 6.4.1 ADVANTEST Corporation
- 6.4.2 Luna Innovations Incorporated
- 6.4.3 TeraView Limited
- 6.4.4 TOPTICA Photonics AG
- 6.4.5 HUBNER GmbH and Co. KG
- 6.4.6 BATOP GmbH
- 6.4.7 Microtech Instruments Inc.
- 6.4.8 Menlo Systems GmbH
- 6.4.9 Gentec-EO Inc.
- 6.4.10 Bakman Technologies LLC
- 6.4.11 QMC Instruments Ltd
- 6.4.12 Bruker Corporation
- 6.4.13 Lytid SAS
- 6.4.14 Attocube Systems AG
- 6.4.15 Helmut Fischer GmbH
- 6.4.16 Baugh and Weedon Ltd
- 6.4.17 Das-nano S.L.
- 6.4.18 Teravil Ltd
- 6.4.19 Terasense Group Inc.
- 6.4.20 Virginia Diodes Inc.
7 MARKET OPPORTUNITIES AND FUTURE OUTLOOK
- 7.1 White-space and Unmet-need Assessment

