
PUBLISHER: Mordor Intelligence | PRODUCT CODE: 1939628

PUBLISHER: Mordor Intelligence | PRODUCT CODE: 1939628
Surfactants - Market Share Analysis, Industry Trends & Statistics, Growth Forecasts (2026 - 2031)
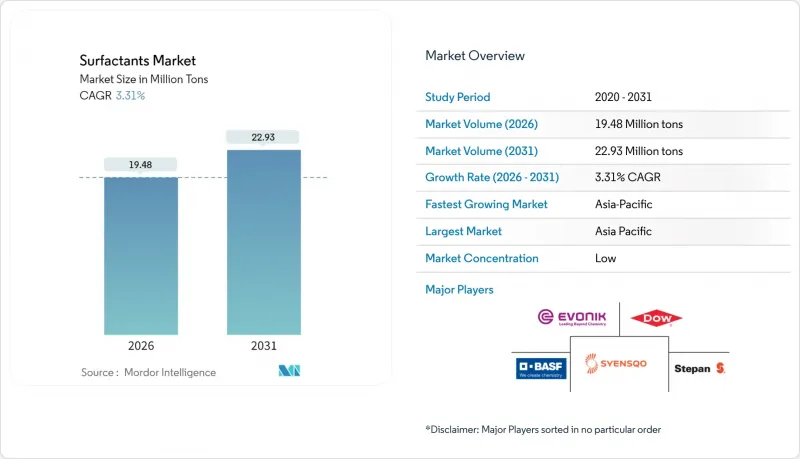
Surfactants market size in 2026 is estimated at 19.48 Million tons, growing from 2025 value of 18.86 Million tons with 2031 projections showing 22.93 Million tons, growing at 3.31% CAGR over 2026-2031.
Adoption of multifunctional mild surfactants in premium personal-care formats, cold-water laundry detergents that cut energy use, and bio-based feedstocks that satisfy tightening sustainability rules are setting the competitive agenda. Meanwhile, persistent price volatility tied to China's periodic overcapacity cycles and long-chain alcohol supply swings keeps cost discipline front-of-mind for producers. Integrated players leverage global supply chains and research and development depth to defend share, but specialty biosurfactant suppliers and agile regional firms in Asia-Pacific are steadily eroding historical advantages.
Global Surfactants Market Trends and Insights
Growing Demand for Multifunctional Mild Surfactants in Water-less Personal-Care Formats
Brands are prioritizing skin compatibility and environmental credentials, prompting formulators to shift from traditional sulfate systems to glucamides and isethionates that deliver gentle cleansing and conditioning in concentrated bars, sticks, and powders. Clariant's studies show these molecules cut rinse-water volume and energy use while maintaining foaming sensory cues valued by consumers. North American and European shoppers pay premiums for such formats, encouraging BASF to widen its EcoBalanced betaine line that trims product carbon footprints by as much as 30% compared with petro-based counterparts. Rapid ingredient iteration and targeted marketing around water stewardship are preparing the surfactants market for sustained adoption once Asian consumers gravitate toward solid cleansers.
Shift to Bio-Based Feedstocks Enabled by C6-C12 Fatty-Acid Over-Supply
Indonesia's B35 biodiesel mandate and similar programs unlock abundant medium-chain fatty acids priced competitively with naphtha-based chains, tipping the economics toward renewable surfactant routes. European producers deploy biomass-balance approaches that substitute fossil carbon with renewable inputs without rebuilding assets, while Evonik's new rhamnolipid plant in Slovakia demonstrates scalable fermentation on European corn sugar. Policy drivers such as the EU's Deforestation-Free Regulation and Scope 3 carbon accounting sharpen the cost of staying fossil-based, edging synthetic incumbents in the surfactants industry toward mixed portfolios that better align with brand sustainability pledges.
Stringent PFAS Phase-Out Accelerating Reformulation Costs
Regulators in the EU and the United States have fast-tracked restrictions on per- and polyfluoroalkyl substances, directly affecting roughly 38% of current surfactant end-uses. DIC has already commercialized PFAS-free defoamers for electric vehicle lubricants that match the legacy performance envelope, but the required research and development investment raises unit costs across multiple downstream markets. Reformulation cascades force new stabilizer and processing regimes, stretching technical resources at smaller firms and accelerating consolidation. Early-moving suppliers able to certify compliance win preferred-vendor status even if price premiums persist, influencing the surfactants market.
Other drivers and restraints analyzed in the detailed report include:
- Rise of Enhanced-Oil-Recovery (EOR) Projects in MEA and China
- On-Site Fermentation of Sophorolipids at Contract Formulators
- Long-Chain Alcohol Volatility Linked to Biodiesel Policy Swings
For complete list of drivers and restraints, kindly check the Table Of Contents.
Segment Analysis
Anionic surfactants retained a commanding 47.80% surfactant market share in 2025 as linear alkylbenzene sulfonate (LAS) remained cost-effective and widely approved for household detergents. LAS volumes surpassed 4 million tons, benefiting from scale economies and established supply chains. However, amphoteric molecules such as betaines and amino oxides are projected to record a 4.30% CAGR, the fastest among all types, propelled by their mildness across pH ranges and ability to stabilize complex formulations in premium personal care. The surfactants market is already witnessing major players brandishing eco-certified betaines that secure higher margins while meeting retailer clean-beauty scorecards.
Cationic segments remain small but indispensable in fabric softening and antimicrobial quaternary blends, whereas silicone surfactants carve out niches in textile finishing, enhanced oil recovery, and high-stretch polyurethane foams where their spreadability outperforms carbon-based analogs.
The Surfactants Report is Segmented by Type (Anionic Surfactants, Cationic Surfactants, and More), Origin (Synthetic Surfactants and Bio-Based Surfactants), Application (Household Soap and Detergent, Personal Care, Lubricants and Fuel Additives, Industry and Institutional Cleaning, and More), and Geography (Asia-Pacific, North America, Europe, and More). The Market Forecasts are Provided in Terms of Volume (Tons).
Geography Analysis
Asia-Pacific held 48.40% of the total surfactants market share in 2025 and is projected to expand at a 4.24% CAGR to 2031, underpinned by China's dominant manufacturing base, India's rising middle class, and Southeast Asia's rapid urban migration. China alone supplies more than half of global LAS output, enabling aggressive pricing that feeds both domestic detergents and overseas exports.
The EU's deforestation-free sourcing rules and pending green-claim directives push brand owners to validate traceable feedstocks, bolstering biosurfactant pilots financed via corporate sustainability budgets. The United States emphasizes performance gains, particularly in concentrated laundry liquids and all-purpose wipes that trim packaging waste. Both regions bear the brunt of PFAS reformulation costs yet house the research hubs capable of fast-tracking compliant alternatives, reinforcing their roles as launch pads for next-generation chemistries that later migrate to emerging markets in the surfactants market.
Surfactant-polymer flooding campaigns in Abu Dhabi and Oman open premium avenues for high-temperature, high-salinity blends, while Nigeria and Kenya witness rising consumption of packaged detergents as urbanization accelerates. Brazil leverages its ample fatty-acid by-products from soy and sugarcane biofuels to back-integrate renewable surfactants, offering cost relief against foreign exchange volatility. Infrastructure gaps, logistics costs, and economic cycles remain hurdles, yet manufacturers partnering with local tollers and distributors mitigate exposure and deepen the surfactants market footprint.
- 3M
- Arkema
- Ashland
- BASF
- Bayer AG
- CEPSA
- Clariant
- Croda International Plc
- Dow
- Emery Oleochemicals
- Evonik Industries AG
- Galaxy Surfactants
- GEO
- Godrej Industries Limited
- Indorama Ventures Public Limited
- Innospec
- Kao Corporation
- KLK OLEO
- Lankem
- Lonza
- Nouryon
- P&G Chemicals
- Reliance Industries Limited
- SANYO CHEMICAL INDUSTRIES, LTD.
- Sasol Limited Group
- Sinopec (China Petrochemical Corporation)
- Syensqo
- Stepan Company
- Sulfatrade SA
- Sumitomo Chemical Co., Ltd.
- Taiwan NJC Corporation
- TENSAC
- YPF
Additional Benefits:
- The market estimate (ME) sheet in Excel format
- 3 months of analyst support
TABLE OF CONTENTS
1 Introduction
- 1.1 Study Assumptions and Market Definition
- 1.2 Scope of the Study
2 Research Methodology
3 Executive Summary
4 Market Landscape
- 4.1 Market Overview
- 4.2 Market Drivers
- 4.2.1 Growing demand for multifunctional mild surfactants in water-less personal-care formats
- 4.2.2 Boom in low-temperature laundry detergents demanding high-performance anionics
- 4.2.3 Shift to bio-based feedstocks enabled by C6-C12 fatty-acid over-supply
- 4.2.4 Rise of enhanced-oil-recovery (EOR) projects in MEA and China
- 4.2.5 On-site fermentation of sophorolipids at contract formulators
- 4.3 Market Restraints
- 4.3.1 Stringent PFAS phase-out accelerating reformulation costs
- 4.3.2 Long-chain alcohol volatility linked to biodiesel policy swings
- 4.3.3 Capacity additions in China triggering periodic price wars
- 4.4 Value Chain Analysis
- 4.5 Porter's Five Forces
- 4.5.1 Bargaining Power of Suppliers
- 4.5.2 Bargaining Power of Buyers
- 4.5.3 Threat of New Entrants
- 4.5.4 Threat of Substitutes
- 4.5.5 Degree of Competition
- 4.6 Pricing Analysis
5 Market Size and Growth Forecasts (Volume)
- 5.1 By Type
- 5.1.1 Anionic Surfactants
- 5.1.1.1 Linear Alkylbenzene Sulfonate (LAS or LABS)
- 5.1.1.2 Alcohol Ether Sulfates (AES)
- 5.1.1.3 Alpha Olefin Sulfonates (AOS)
- 5.1.1.4 Secondary Alkane Sulfonate (SAS)
- 5.1.1.5 Methyl Ester Sulfonates (MES)
- 5.1.1.6 Sulfosuccinates
- 5.1.1.7 Others (Lignosulfonates, etc.)
- 5.1.2 Cationic Surfactants
- 5.1.2.1 Quaternary ammonium compound
- 5.1.2.2 Others
- 5.1.3 Non-ionic Surfactants
- 5.1.3.1 Alcohol ethoxylate
- 5.1.3.2 Ethoxylated Alkyl-phenols
- 5.1.3.3 Fatty acid ester
- 5.1.3.4 Others
- 5.1.4 Amphoteric Surfactants
- 5.1.5 Silicone Surfactants
- 5.1.1 Anionic Surfactants
- 5.2 By Origin
- 5.2.1 Synthetic Surfactants
- 5.2.2 Bio-based Surfactants
- 5.3 By Application
- 5.3.1 Household Soap and Detergent
- 5.3.2 Personal Care
- 5.3.3 Lubricants and Fuel Additives
- 5.3.4 Industry and Institutional Cleaning
- 5.3.5 Food Processing
- 5.3.6 Oilfield Chemicals
- 5.3.7 Agricultural Chemicals
- 5.3.8 Textile Processing
- 5.3.9 Emulsion Polymerisation
- 5.3.10 Other Applications
- 5.4 By Geography
- 5.4.1 Asia-Pacific
- 5.4.1.1 China
- 5.4.1.2 India
- 5.4.1.3 Japan
- 5.4.1.4 South Korea
- 5.4.1.5 ASEAN
- 5.4.1.6 Rest of Asia-Pacific
- 5.4.2 North America
- 5.4.2.1 United States
- 5.4.2.2 Canada
- 5.4.2.3 Mexico
- 5.4.3 Europe
- 5.4.3.1 Germany
- 5.4.3.2 United Kingdom
- 5.4.3.3 France
- 5.4.3.4 Italy
- 5.4.3.5 Russia
- 5.4.3.6 Rest of Europe
- 5.4.4 South America
- 5.4.4.1 Brazil
- 5.4.4.2 Argentina
- 5.4.4.3 Rest of South America
- 5.4.5 Middle-East and Africa
- 5.4.5.1 Saudi Arabia
- 5.4.5.2 South Africa
- 5.4.5.3 Rest of Middle-East and Africa
- 5.4.1 Asia-Pacific
6 Competitive Landscape
- 6.1 Market Concentration
- 6.2 Strategic Moves
- 6.3 Market Share (%)/Ranking Analysis
- 6.4 Company Profiles (includes Global level Overview, Market level overview, Core Segments, Financials as available, Strategic Information, Market Rank/Share, Products and Services, Recent Developments)
- 6.4.1 3M
- 6.4.2 Arkema
- 6.4.3 Ashland
- 6.4.4 BASF
- 6.4.5 Bayer AG
- 6.4.6 CEPSA
- 6.4.7 Clariant
- 6.4.8 Croda International Plc
- 6.4.9 Dow
- 6.4.10 Emery Oleochemicals
- 6.4.11 Evonik Industries AG
- 6.4.12 Galaxy Surfactants
- 6.4.13 GEO
- 6.4.14 Godrej Industries Limited
- 6.4.15 Indorama Ventures Public Limited
- 6.4.16 Innospec
- 6.4.17 Kao Corporation
- 6.4.18 KLK OLEO
- 6.4.19 Lankem
- 6.4.20 Lonza
- 6.4.21 Nouryon
- 6.4.22 P&G Chemicals
- 6.4.23 Reliance Industries Limited
- 6.4.24 SANYO CHEMICAL INDUSTRIES, LTD.
- 6.4.25 Sasol Limited Group
- 6.4.26 Sinopec (China Petrochemical Corporation)
- 6.4.27 Syensqo
- 6.4.28 Stepan Company
- 6.4.29 Sulfatrade SA
- 6.4.30 Sumitomo Chemical Co., Ltd.
- 6.4.31 Taiwan NJC Corporation
- 6.4.32 TENSAC
- 6.4.33 YPF
7 Market Opportunities and Future Outlook
- 7.1 White-space and Unmet-need Assessment

