
PUBLISHER: Mordor Intelligence | PRODUCT CODE: 1939724

PUBLISHER: Mordor Intelligence | PRODUCT CODE: 1939724
United States Refrigerated Trucking - Market Share Analysis, Industry Trends & Statistics, Growth Forecasts (2026 - 2031)
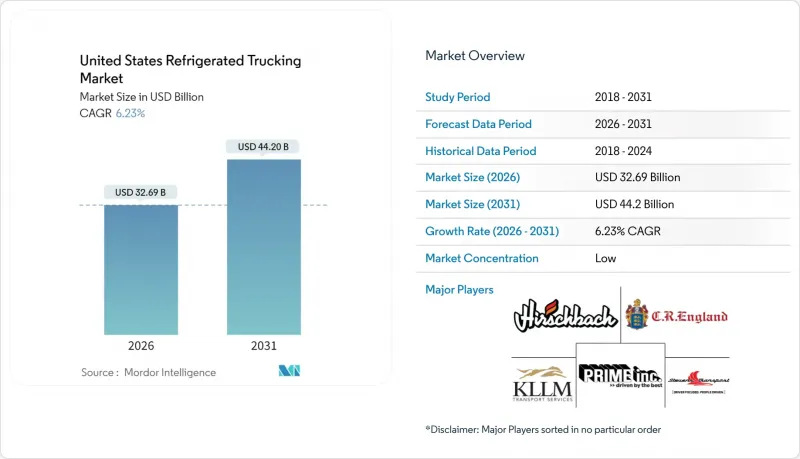
The United States refrigerated trucking market size in 2026 is estimated at USD 32.69 billion, growing from 2025 value of USD 30.77 billion with 2031 projections showing USD 44.2 billion, growing at 6.23% CAGR over 2026-2031.
Growth stems from several converging forces: sustained consumer demand for year-round fresh food, expanding ultra-cold pharmaceutical distribution, and rising e-commerce grocery orders that shorten delivery windows. Operators are upgrading fleets with electric transport-refrigeration units to comply with zero-emission mandates, while artificial-intelligence routing platforms lower empty-mile ratios and spoilage costs. Consolidation among top carriers provides scale for expensive technology investments, yet a fragmented tail of regional specialists remains crucial for last-mile coverage. Parallel investment in modern cold-storage nodes underpins network optimization, especially in Texas, the Gulf Coast, and Midwest agribusiness corridors.
United States Refrigerated Trucking Market Trends and Insights
FSMA Enforcement Spurring Upgrades in Refrigerated Fleets
Section 204 of the Food Safety Modernization Act takes full effect in January 2026 and obliges carriers to furnish 24-hour traceability records for foods on the FDA's list. Fleets are outfitting vans with IoT sensors, blockchain-enabled documentation, and GPS temperature probes, cutting spoilage by 30% while lifting on-time performance by 25%. Early adopters market compliance as a premium service for pharma shippers, who face recall costs of USD 78,000 per incident when excursions occur. The regulation thereby transforms traceability from a cost center into a competitive differentiator, pushing laggards toward tech-enabled retrofits or acquisition by better-capitalized rivals.
Rapid Growth in Home-Delivered Groceries Increasing Regional Cold-Chain Capacity
E-commerce grocery receipts are set to total USD 1.24 trillion in 2025, with last-mile activity representing roughly 50% of logistics spend. Retailers are allocating more than USD 1 billion to automated cold-storage hubs positioned closer to dense urban clusters. Modular refrigeration panels enable flexible temperature zoning, letting carriers combine produce, dairy, and frozen SKUs on the same route without cross-contamination. Innovative lockers and portable cooling totes preserve integrity when end-consumers miss delivery windows, shrinking spoilage write-offs and reinforcing brand loyalty. Demand for high-frequency, low-volume drops thereby elevates regional specialists in the United States refrigerated trucking market, particularly around New York, Los Angeles, and Seattle.
Shortage of Reefer-Qualified Drivers is Putting Upward Pressure on Labor Costs
Vacancies total 24,043 seats, costing USD 95.5 million weekly in forgone revenue. Reefer duties demand temperature checks, hazmat familiarity, and tighter appointment windows, narrowing the qualified labor pool relative to dry-van work. Cold-warehouse turnover elevates wait-time frustrations, worsening attrition. Although FMCSA exemptions let carriers seat commercial-learner-permit holders without CDL escorts, safety concerns remain. Enhanced compensation and upskilling programs are becoming table stakes across the United States refrigerated trucking market.
Other drivers and restraints analyzed in the detailed report include:
- Rising Demand for Specialty Pharmaceuticals Requiring Ultra-Cold Transport Lanes
- AI-Powered Dynamic Routing Helps Reduce Spoilage and Minimize Empty Miles
- Stricter TRU Emissions Regulations are Increasing Capital Costs
For complete list of drivers and restraints, kindly check the Table Of Contents.
Segment Analysis
Processed Food Products are expected to expand at a 7.02% CAGR (2026-2031), outstripping all other verticals in the United States refrigerated trucking market. Meats, Fish, and Poultry maintained a 21.42% United States refrigerated trucking market share in 2025, signifying continued reliance on uninterrupted cold-chain links.
Meal-kit providers and frozen entree brands now demand SKU-level temperature data, spurring investments in reefer compartmentalization and controlled-atmosphere packaging. Carrier collaboration with food processors yields pre-cool staging protocols that cut ambient ingress at dock doors. Healthcare and pharmaceutical shippers leverage ultra-cold validation lanes created for biologics, while horticultural exporters benefit from USDA-funded backhaul upgrades, extending shelf life for berries and leafy greens en route to Midwest distribution hubs. Advanced polymer linings inside trailers allow rapid temperature swings for dairy products, enabling mixed-load economics without violating product-specific storage rules.
Non-containerized reefers kept an 85.45% United States refrigerated trucking market share in 2025, owing to specialized hardware and lane flexibility. Containerized refrigerated flows are expected to grow at a 6.41% CAGR (2026-2031) as port authorities expand plug-in points, and carriers sync rail and truck hand-offs to shrink door-to-door transit times.
Houston ColdPort's 315,101 ft2 facility and Port Gulfport's USD 73 million expansion create new intermodal staging nodes that shorten drayage distance and slash demurrage risk. IoT-sensor arrays embedded in reefer containers track shock, humidity, and location, helping shippers validate integrity across marine-rail-road segments.
Long haul freight claims 71.60% of the revenue share in 2025 and is expected to grow the fastest at 6.54% CAGR (2026-2031) as cross-country produce, meat, and pharma volumes escalate. Autonomous pilots amassed 50,000 miles without accident on the Atlanta-Dallas lane, foreshadowing cost reductions once regulatory green lights emerge.
Extended-range diesel-electric hybrids prolong asset life in harsh desert corridors, while predictive maintenance platforms alert terminals to compressor wear mid-route. Short-haul lanes enjoy electrification gains, but battery-density constraints and sparse highway charging keep long-haul diesel viable through 2030, underpinning the bulk of the United States refrigerated trucking market.
The United States Refrigerated Trucking Market Report is Segmented by Application (Processed Food Products and More), Truckload Specification (Full-Truck-Load (FTL) and More), Containerization (Containerized and More), Distance (Long Haul and More), Goods Configuration (Fluid Goods and More), Destination (Domestic and International), and Temperature Type (Chilled and More). The Market Forecasts are Provided in Terms of Value (USD).
List of Companies Covered in this Report:
- ATS (Anderson Trucking Service)
- Bay and Bay Transportation
- C.R. England
- Covenant Logistics Group, Inc. (Including Southern Refrigerated Transport)
- Decker Truck Line, Inc.
- FFE (Frozen Food Express) Transportation Services, Inc. (Owned by Duff Capital Investors)
- Freymiller, Inc.
- Hirschbach Motor Lines, Inc.
- J&R Schugel Trucking
- K&B Transportation
- KLLM Transport Services (Owned by Duff Capital Investors)
- Knight-Swift Transportation Holdings, Inc. (Including Swift Transportation Company)
- Leonards Express
- Marten Transport, Ltd.
- Penske Corporation, Inc. (Including Black Horse Carriers, Inc.)
- Prime, Inc.
- Roehl Transport, Inc.
- Ryder System, Inc. (Including Cardinal Logistics)
- Stevens Transport, Inc.
- TransAm Trucking, Inc.
- WEL Companies
Additional Benefits:
- The market estimate (ME) sheet in Excel format
- 3 months of analyst support
TABLE OF CONTENTS
1 Introduction
- 1.1 Study Assumptions and Market Definition
- 1.2 Scope of the Study
2 Research Methodology
3 Executive Summary
4 Market Landscape
- 4.1 Market Overview
- 4.2 Demographics
- 4.3 GDP Distribution by Economic Activity
- 4.4 GDP Growth by Economic Activity
- 4.5 Economic Performance and Profile
- 4.5.1 Trends in E-Commerce Industry
- 4.5.2 Trends in Manufacturing Industry
- 4.6 Transport and Storage Sector GDP
- 4.7 Logistics Performance
- 4.8 Length of Roads
- 4.9 Export Trends
- 4.10 Import Trends
- 4.11 Fuel Pricing Trends
- 4.12 Trucking Operational Costs
- 4.13 Road Freight Tonnage Trends
- 4.14 Road Freight Pricing Trends
- 4.15 Modal Share
- 4.16 Inflation
- 4.17 Regulatory Framework
- 4.18 Value Chain and Distribution Channel Analysis
- 4.19 Market Drivers
- 4.19.1 FSMA Enforcement Spurring Upgrades in Refrigerated Fleets
- 4.19.2 Rapid Growth in Home-Delivered Groceries Increasing Demand for Regional Cold Chain Capacity
- 4.19.3 Rising Demand for Specialty Pharmaceuticals Requiring Ultra-Cold (Below -20°C) Transport Lanes
- 4.19.4 Electrified TRUs Benefiting from State-Level Zero-Emission Incentive Programs
- 4.19.5 AI-Powered Dynamic Routing Helping Reduce Spoilage and Minimize Empty Miles
- 4.19.6 Agricultural Export Corridor Grants (e.g., Gulf Coast Produce) Improving Back-Haul Utilization
- 4.20 Market Restraints
- 4.20.1 Shortage of Reefer-Qualified Drivers Putting Upward Pressure on Labor Costs
- 4.20.2 Stricter TRU Emissions Regulations Increasing Capital Costs
- 4.20.3 Uncertainty over Lithium-Ion Battery Fire Codes Slowing Adoption of Electric TRUs
- 4.20.4 Cybersecurity Breaches Targeting Cold Chain Telematics Disrupting Operations
- 4.21 Technology Innovations in the Market
- 4.22 Porter's Five Forces Analysis
- 4.22.1 Threat of New Entrants
- 4.22.2 Bargaining Power of Buyers
- 4.22.3 Bargaining Power of Suppliers
- 4.22.4 Threat of Substitutes
- 4.22.5 Competitive Rivalry
5 Market Size and Growth Forecasts (Value, USD)
- 5.1 Application
- 5.1.1 Horticultural Products
- 5.1.2 Dairy Products
- 5.1.3 Meats, Fish, and Poultry
- 5.1.4 Processed Food Products
- 5.1.5 Healthcare and Pharmaceutical
- 5.1.6 Other Applications
- 5.2 Truckload Specification
- 5.2.1 Full-Truck-Load (FTL)
- 5.2.2 Less than-Truck-Load (LTL)
- 5.3 Containerization
- 5.3.1 Containerized
- 5.3.2 Non-Containerized
- 5.4 Distance
- 5.4.1 Long Haul
- 5.4.2 Short Haul
- 5.5 Goods Configuration
- 5.5.1 Fluid Goods
- 5.5.2 Solid Goods
- 5.6 Destination
- 5.6.1 Domestic
- 5.6.2 International
- 5.7 Temperature Type
- 5.7.1 Chilled
- 5.7.2 Frozen
- 5.7.3 Ambient
6 Competitive Landscape
- 6.1 Market Concentration
- 6.2 Key Strategic Moves
- 6.3 Market Share Analysis
- 6.4 Company Profiles (Includes Global Level Overview, Market Level Overview, Core Segments, Financials as Available, Strategic Information, Market Rank/Share for Key Companies, Products and Services, and Recent Developments)
- 6.4.1 ATS (Anderson Trucking Service)
- 6.4.2 Bay and Bay Transportation
- 6.4.3 C.R. England
- 6.4.4 Covenant Logistics Group, Inc. (Including Southern Refrigerated Transport)
- 6.4.5 Decker Truck Line, Inc.
- 6.4.6 FFE (Frozen Food Express) Transportation Services, Inc. (Owned by Duff Capital Investors)
- 6.4.7 Freymiller, Inc.
- 6.4.8 Hirschbach Motor Lines, Inc.
- 6.4.9 J&R Schugel Trucking
- 6.4.10 K&B Transportation
- 6.4.11 KLLM Transport Services (Owned by Duff Capital Investors)
- 6.4.12 Knight-Swift Transportation Holdings, Inc. (Including Swift Transportation Company)
- 6.4.13 Leonards Express
- 6.4.14 Marten Transport, Ltd.
- 6.4.15 Penske Corporation, Inc. (Including Black Horse Carriers, Inc.)
- 6.4.16 Prime, Inc.
- 6.4.17 Roehl Transport, Inc.
- 6.4.18 Ryder System, Inc. (Including Cardinal Logistics)
- 6.4.19 Stevens Transport, Inc.
- 6.4.20 TransAm Trucking, Inc.
- 6.4.21 WEL Companies
7 Market Opportunities and Future Outlook
- 7.1 White-space and Unmet-need Assessment

