
PUBLISHER: Mordor Intelligence | PRODUCT CODE: 1940686

PUBLISHER: Mordor Intelligence | PRODUCT CODE: 1940686
US Smart TV - Market Share Analysis, Industry Trends & Statistics, Growth Forecasts (2026 - 2031)
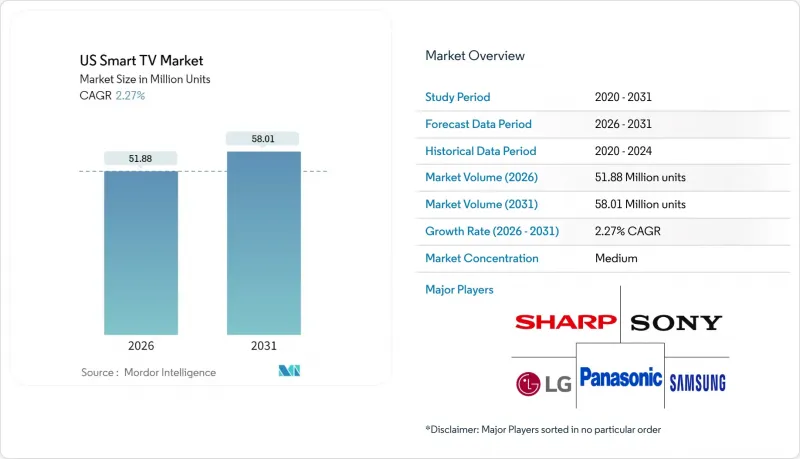
The US Smart TV market was valued at 50.73 million units in 2025 and estimated to grow from 51.88 million units in 2026 to reach 58.01 million units by 2031, at a CAGR of 2.27% during the forecast period (2026-2031).
End-user demand is shifting toward premium picture quality, integrated streaming ecosystems, and gaming-ready features, even as overall growth moderates in a maturing consumer electronics category. The momentum behind large formats, notably 55-64 inch sets, continues to anchor mainstream volumes, while ultra-large 75-inch-plus screens turn into the primary aspirational purchase. At the same time, panel innovation cycles, 4-stack OLED, mini-LED, and emerging RGB backlighting, are shortening replacement timelines. Platform monetization through connected-TV (CTV) advertising now subsidizes hardware prices, helping brands defend unit share against aggressive price compression from new Chinese entrants. Finally, state-level energy incentives and tightening data-privacy rules both shape product development priorities, underlining the complex regulatory environment surrounding the US Smart TV market.
US Smart TV Market Trends and Insights
Rapid 4K/8K upgrade cycle
4K UHD already dominates more than half of shipments, yet manufacturers are shortening the technology cycle by mainstreaming 8K-ready processors and advanced backlighting. Samsung's RGB mini-LED prototypes shown in 2025 promise OLED-level contrast while holding LCD cost parity. LG's four-stack OLED architecture lifts peak brightness by 40%, solving HDR limitations that once slowed premium adoption. These step-changes jointly nudge existing owners toward earlier replacement, especially as streaming and next-gen consoles gradually expose 8K native content.
Built-in streaming and app ecosystems
Smart-TV operating systems now replicate the functionality of external sticks, bringing storefronts, payments, and targeted ads under the television brand. Roku OS still accounts for the largest footprint, but Google TV is the fastest riser as search personalization drives watch-time. LG reports that its webOS ad-tech revenue surpassed KRW 1 trillion in 2024, proof that platform economics increasingly offset hardware margin compression.
Smartphone/tablet viewing cannibalization
Mobile screens increasingly capture daytime entertainment minutes, limiting shared viewing occasions that traditionally justified large-screen upgrades. The Federal Trade Commission's 2024 study highlights how streaming platforms over-index their UI design for handheld devices, reinforcing single-user consumption habits. Yet gaming and premium cinematic content remain television strongholds, tempering the cannibalization effect.
Other drivers and restraints analyzed in the detailed report include:
- Surge in larger-than-65" purchases
- CTV advertising revenue sharing creates new business models
- Price compression from low-cost Chinese brands
For complete list of drivers and restraints, kindly check the Table Of Contents.
Segment Analysis
The 55-64 inch band retained a leading 34.02% shipment share in 2025, confirming its role as the mainstream sweet spot. However, the 75-inch-plus segment is set to grow fastest at 2.69% CAGR, outpacing overall US Smart TV market growth. Early adopters cite immersive gaming and theater-grade streaming as justification for purchasing panels that now cost under USD 2,000 at promotion. Samsung commands roughly one-third of ultra-large formats by leveraging its micro-LED supply chain and aggressive channel promotions. Entry-level sub-45-inch models continue sliding, squeezed by cheap tablets for personal viewing and by mid-sized sets that increasingly fit smaller apartments thanks to bezel minimization.
Installers report that wireless breakout boxes reduce setup time by almost 40%, accelerating acceptance of wall-mounted 75-inch screens in existing homes. ENERGY STAR data suggest power consumption per square inch is falling faster than panel area is rising, muting electricity-cost objections among energy-conscious buyers. Collectively, these trends mean that large-format displays will remain the headline growth driver inside the US Smart TV market.
4K UHD reached 54.02% shipment share in 2025, having already become table stakes. The nascent 8K segment is projected to post a 3.17% CAGR, aided by AI-upscaling engines that mask source-content scarcity. Microsoft's Xbox Series X and Sony's PlayStation 5 Pro both enabled 8K output in 2025 firmware updates, and streaming providers have begun test runs of 8K VOD in limited markets. Upsell tactics pair 8K panels with shorter finance plans to offset sticker shock, ensuring early adopters rotate into the pool every 3-4 years. Full-HD models now survive mainly in hospitality and price-first retail doorbusters.
OLED providers argue that brightness gains close the perceived advantage of 8K over high-quality 4K HDR, but survey data show that early gamers disproportionately choose 8K sets for their benchmarking bragging rights. As compression codecs mature, bandwidth overhead for 8K streams will fall, removing one of the last technical hurdles to mass deployment.
The US Smart TV Market Report is Segmented by Screen Size (Up To 45", 45-54", 55-64", 65-74", 75" & Above), Resolution Type (HDTV, Full HD, 4K UHD, 8K UHD), Panel Technology (LCD/LED, QLED, OLED, Mini-LED), Price Band (less Than USD 500, USD 500-999, and More), Operating System (Roku OS, Google/Android TV, and More), and Geography. The Market Forecasts are Provided in Terms of Volume (Units).
List of Companies Covered in this Report:
- Samsung Electronics Co., Ltd.
- LG Electronics Inc.
- Sony Group Corporation
- TCL Electronics Holdings Ltd.
- VIZIO Holding Corp.
- Hisense Group Co., Ltd.
- Panasonic Holdings Corporation
- Sharp Corporation
- Koninklijke Philips N.V.
- Skyworth Group Ltd.
- Xiaomi Corp.
- Amazon.com Inc. (Fire TV Devices)
- Apple Inc. (Apple TV & tvOS Integrations)
- Haier Smart Home Co., Ltd.
- Funai Electric Co., Ltd. (Magnavox/Sanyo)
- Westinghouse Electric Corp.
- Sceptre Inc.
- Insignia Systems Inc. (Insignia TV)
- JVC Kenwood Corp.
- Pioneer Corp.
- Seiki Digital Inc.
- Element Electronics LLC
- Hitachi Ltd.
- LeEco (LeTV)
- Metz Consumer Electronics GmbH
- B&O A/S (Bang & Olufsen)
Additional Benefits:
- The market estimate (ME) sheet in Excel format
- 3 months of analyst support
TABLE OF CONTENTS
1 INTRODUCTION
- 1.1 Study Assumptions and Market Definition
- 1.2 Scope of the Study
2 RESEARCH METHODOLOGY
3 EXECUTIVE SUMMARY
4 MARKET LANDSCAPE
- 4.1 Market Overview
- 4.2 Market Drivers
- 4.2.1 Rapid 4K/8K upgrade cycle
- 4.2.2 Built-in streaming and app ecosystems
- 4.2.3 Surge in larger-than-65" purchases
- 4.2.4 CTV advertising-revenue sharing with OEMs
- 4.2.5 Gaming-optimized TV features (VRR, cloud gaming hubs)
- 4.2.6 Energy-efficiency tax incentives for "ENERGY STAR 9.0" sets
- 4.3 Market Restraints
- 4.3.1 Smartphone/tablet viewing cannibalization
- 4.3.2 Price compression from low-cost Chinese brands
- 4.3.3 OS-level data-privacy pushback curbing telemetry value
- 4.3.4 Supply-chain volatility in mini-LED backlights
- 4.4 Value Chain Analysis
- 4.5 Regulatory Landscape
- 4.6 Technological Outlook
- 4.7 Porter's Five Forces
- 4.7.1 Bargaining Power of Suppliers
- 4.7.2 Bargaining Power of Buyers
- 4.7.3 Threat of New Entrants
- 4.7.4 Threat of Substitutes
- 4.7.5 Competitive Rivalry
- 4.8 Industry Value-Chain Mapping
5 MARKET SIZE AND GROWTH FORECASTS (VOLUME)
- 5.1 By Screen Size
- 5.1.1 Up to 45"
- 5.1.2 45-54"
- 5.1.3 55-64"
- 5.1.4 65-74"
- 5.1.5 75" and Above
- 5.2 By Resolution Type
- 5.2.1 HDTV
- 5.2.2 Full HD
- 5.2.3 4K UHD
- 5.2.4 8K UHD
- 5.3 By Panel Technology
- 5.3.1 LCD/LED
- 5.3.2 QLED
- 5.3.3 OLED
- 5.3.4 Mini-LED
- 5.4 By Price Band
- 5.4.1 less than USD 500
- 5.4.2 USD 500-999
- 5.4.3 USD 1,000-1,999
- 5.4.4 More than USD 2,000
- 5.5 By Operating System
- 5.5.1 Roku OS
- 5.5.2 Google/Android TV
- 5.5.3 Tizen OS
- 5.5.4 webOS
- 5.5.5 Fire TV OS
- 5.5.6 VIDAA U
6 COMPETITIVE LANDSCAPE
- 6.1 Market Concentration
- 6.2 Strategic Moves
- 6.3 Market Share Analysis
- 6.4 Vendor Market Ranking Analysis
- 6.5 Company Profiles (includes Global level Overview, Market level overview, Core Segments, Financials as available, Strategic Information, Market Rank/Share, Products and Services, Recent Developments)
- 6.5.1 Samsung Electronics Co., Ltd.
- 6.5.2 LG Electronics Inc.
- 6.5.3 Sony Group Corporation
- 6.5.4 TCL Electronics Holdings Ltd.
- 6.5.5 VIZIO Holding Corp.
- 6.5.6 Hisense Group Co., Ltd.
- 6.5.7 Panasonic Holdings Corporation
- 6.5.8 Sharp Corporation
- 6.5.9 Koninklijke Philips N.V.
- 6.5.10 Skyworth Group Ltd.
- 6.5.11 Xiaomi Corp.
- 6.5.12 Amazon.com Inc. (Fire TV Devices)
- 6.5.13 Apple Inc. (Apple TV & tvOS Integrations)
- 6.5.14 Haier Smart Home Co., Ltd.
- 6.5.15 Funai Electric Co., Ltd. (Magnavox/Sanyo)
- 6.5.16 Westinghouse Electric Corp.
- 6.5.17 Sceptre Inc.
- 6.5.18 Insignia Systems Inc. (Insignia TV)
- 6.5.19 JVC Kenwood Corp.
- 6.5.20 Pioneer Corp.
- 6.5.21 Seiki Digital Inc.
- 6.5.22 Element Electronics LLC
- 6.5.23 Hitachi Ltd.
- 6.5.24 LeEco (LeTV)
- 6.5.25 Metz Consumer Electronics GmbH
- 6.5.26 B&O A/S (Bang & Olufsen)
7 MARKET OPPORTUNITIES AND FUTURE OUTLOOK
- 7.1 White-Space and Unmet-Need Assessment

