
PUBLISHER: Mordor Intelligence | PRODUCT CODE: 1940783

PUBLISHER: Mordor Intelligence | PRODUCT CODE: 1940783
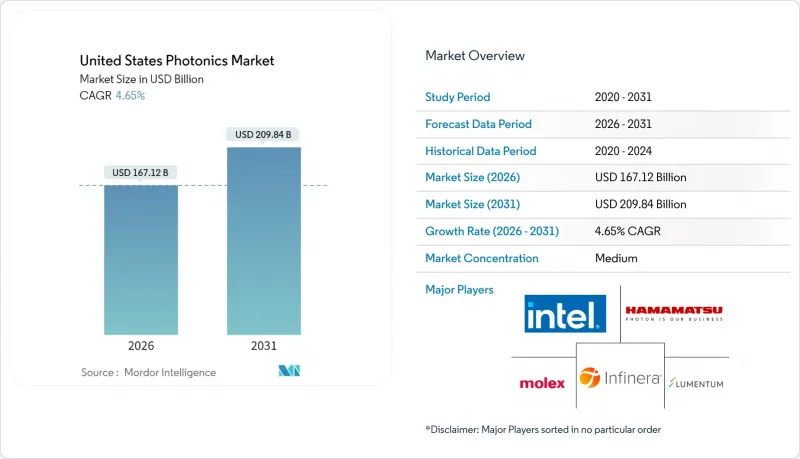
United States Photonics - Market Share Analysis, Industry Trends & Statistics, Growth Forecasts (2026 - 2031)
The United States photonics market is expected to grow from USD 159.69 billion in 2025 to USD 167.12 billion in 2026 and is forecast to reach USD 209.84 billion by 2031 at 4.65% CAGR over 2026-2031.
Surging artificial-intelligence workloads inside hyperscale facilities, a renewed federal push for on-shore manufacturing, and directed-energy programs together shape a demand profile that is broader than prior telecom-centric cycles. Silicon photonics platforms gain momentum because they can be produced on existing CMOS lines, while compound-semiconductor plants benefit from CHIPS Act grants that offset high capital costs. At the same time, healthcare adoption of minimally invasive imaging and photobiomodulation therapies secures a durable second growth engine. Supply security for rare-earths and III-V materials remains a swing factor as germanium and gallium export curbs inflate input costs and trigger domestic substitution efforts.
United States Photonics Market Trends and Insights
AI-driven datacenter optical-I/O boom
A record 60% jump in optical-transceiver shipments in 2024 reflected hyperscale operators' shift from 400 G to 800 G links, and trials for 1.6 T modules are underway. Silicon photonics captured 35% of those volumes because integrated electro-optical dies reduce power per bit and simplify co-packaged optics. Intel and Ayar Labs demonstrated roadmaps toward 3.2 T per package by 2026, ensuring a multi-year pull for integrated photonic circuits. Department of Energy exascale programs reinforce the trend as supercomputers pivot to optical interconnects for energy-efficient scaling.
CHIPS Act domestic manufacturing incentives
The CHIPS and Science Act reserved USD 280 million for photonics projects in 2024, with Coherent receiving USD 112 million to expand indium-phosphide and silicon-carbide capacity and GlobalFoundries gaining USD 75 million for silicon photonics. AIM Photonics' multi-project wafer service lowers entry costs for start-ups by sharing mask sets and fab time, catalyzing a richer domestic supplier base. These incentives shorten lead times, support trusted-supplier mandates, and mitigate exposure to overseas supply disruptions.
Cap-intensive photonic-fab infrastructure
Clean-room requirements of Class 10 for passive and Class 1 for active devices elevate construction outlays well above traditional semiconductor lines. AIM Photonics estimates USD 100-500 million for a full-capacity photonic fab, while metrology tools can cost 2-3X electronic counterparts. Limited domestic fab count forms a capacity bottleneck when demand surges for indium-phosphide or silicon-nitride platforms.
Other drivers and restraints analyzed in the detailed report include:
- Defense laser and directed-energy funding upswing
- Minimally invasive biomedical imaging adoption
- Rare-earth and III-V supply-chain risks
For complete list of drivers and restraints, kindly check the Table Of Contents.
Segment Analysis
Medical Technology captured a 5.83% CAGR outlook, reflecting regulatory approvals that anchor procurement budgets once clinical efficacy is proven. Data Communication still represents the largest slice at 28.35% of the United States photonics market share, propelled by hyperscale traffic migration to 800 G optics. Surveying and Detection gains incremental traction from autonomous-vehicle LiDAR and smart-infrastructure monitoring, while Production Technology leverages high-power lasers for additive manufacturing lines.
Momentum in image-guided surgery and photodynamic therapy sustains a demand profile resilient to macro-economic swings. Lighting and display sub-segments mature, yet horticultural and UV-sterilization niches provide targeted growth. Emerging areas, quantum computing, environmental sensing, and space platforms, create option value for suppliers positioned to spin off proven technologies into new verticals.
Integrated Photonic Circuits are slated for a 6.05% CAGR as customers gravitate toward chip-scale modules that embed sources, modulators, and detectors on a single die. Lasers and Sources hold a 24.05% share, but steady commoditization presses suppliers to bundle control electronics and software. Detectors and Sensors benefit from rising automotive ADAS and point-of-care diagnostics, underscoring sensitivity advances in avalanche photodiodes and single-photon counters.
Optical Fibers and Waveguides maintain baseline demand from rural broadband rollouts, whereas modulators experience a lift from dynamic wavelength switching in cloud backbones. Passive optics suppliers reposition toward harsh-environment spacecraft and subsea systems where pricing power is stronger. Customers increasingly favor vendors offering full subsystems over discrete parts, consolidating the vendor list.
The United States Photonics Market Report is Segmented by Application (Surveying and Detection, Production Technology, and More), Component Type (Lasers and Sources, Detectors and Sensors, and More), End-User Industry (Telecom and Datacenters, Industrial Manufacturing, and More), and Technology (Silicon Photonics, Optical Fiber Photonics, and More). The Market Forecasts are Provided in Terms of Value (USD).
List of Companies Covered in this Report:
- Intel Corporation
- Lumentum Holdings Inc.
- Infinera Corporation
- Molex LLC (Koch Industries)
- Hamamatsu Photonics K.K.
- IPG Photonics Corporation
- Coherent Corp.
- Vescent Photonics Inc.
- Photonic Systems Inc.
- Thorlabs Inc.
- NEC Corporation
- ams OSRAM AG
- TRUMPF SE + Co. KG
- Polatis Ltd. (Huber+Suhner AG)
- Nokia Corporation
- Rockley Photonics Holdings Ltd.
- Lumibird SA
- Acacia Communications Inc. (Cisco)
- GlobalFoundries Inc.
- Analog Photonics LLC
Additional Benefits:
- The market estimate (ME) sheet in Excel format
- 3 months of analyst support
TABLE OF CONTENTS
1 INTRODUCTION
- 1.1 Study Assumptions and Market Definition
- 1.2 Scope of the Study
2 RESEARCH METHODOLOGY
3 EXECUTIVE SUMMARY
4 MARKET LANDSCAPE
- 4.1 Market Overview
- 4.2 Market Drivers
- 4.2.1 AI-driven datacenter optical-I/O boom
- 4.2.2 CHIPS Act domestic manufacturing incentives
- 4.2.3 Defense laser and directed-energy funding upswing
- 4.2.4 Minimally-invasive biomedical imaging adoption
- 4.2.5 Autonomous-vehicle LiDAR integration race
- 4.2.6 Quantum-photonics R&D investments
- 4.3 Market Restraints
- 4.3.1 Cap-intensive photonic-fab infrastructure
- 4.3.2 Photonics-skilled talent shortage
- 4.3.3 Rare-earth / III-V supply-chain risks
- 4.3.4 Standards and ecosystem interoperability gaps
- 4.4 Industry Supply-Chain Analysis
- 4.5 Impact of Macroeconomic Factors
- 4.6 Regulatory Landscape
- 4.7 Technological Outlook
- 4.8 Porter's Five Forces Analysis
- 4.8.1 Bargaining Power of Suppliers
- 4.8.2 Bargaining Power of Buyers/Consumers
- 4.8.3 Threat of New Entrants
- 4.8.4 Threat of Substitutes
- 4.8.5 Intensity of Competitive Rivalry
5 MARKET SIZE AND GROWTH FORECASTS (VALUE)
- 5.1 By Application
- 5.1.1 Surveying and Detection
- 5.1.2 Production Technology
- 5.1.3 Data Communication
- 5.1.4 Image Capture and Display
- 5.1.5 Medical Technology
- 5.1.6 Lighting
- 5.1.7 Other Applications
- 5.2 By Component Type
- 5.2.1 Lasers and Sources
- 5.2.2 Detectors and Sensors
- 5.2.3 Optical Fibers and Waveguides
- 5.2.4 Modulators and Switched Devices
- 5.2.5 Integrated Photonic Circuits
- 5.2.6 Passive Optics (Lenses, Filters, etc.)
- 5.3 By End-User Industry
- 5.3.1 Telecom and Datacenters
- 5.3.2 Industrial Manufacturing
- 5.3.3 Healthcare and Life Sciences
- 5.3.4 Defense and Aerospace
- 5.3.5 Consumer Electronics
- 5.3.6 Energy and Environment
- 5.4 By Technology
- 5.4.1 Silicon Photonics
- 5.4.2 Optical Fiber Photonics
- 5.4.3 Free-space and Diffractive Optics
- 5.4.4 Quantum and Non-linear Photonics
6 COMPETITIVE LANDSCAPE
- 6.1 Market Concentration
- 6.2 Strategic Moves
- 6.3 Market Share Analysis
- 6.4 Company Profiles (includes Global level Overview, Market level overview, Core Segments, Financials as available, Strategic Information, Market Rank/Share for key companies, Products and Services, and Recent Developments)
- 6.4.1 Intel Corporation
- 6.4.2 Lumentum Holdings Inc.
- 6.4.3 Infinera Corporation
- 6.4.4 Molex LLC (Koch Industries)
- 6.4.5 Hamamatsu Photonics K.K.
- 6.4.6 IPG Photonics Corporation
- 6.4.7 Coherent Corp.
- 6.4.8 Vescent Photonics Inc.
- 6.4.9 Photonic Systems Inc.
- 6.4.10 Thorlabs Inc.
- 6.4.11 NEC Corporation
- 6.4.12 ams OSRAM AG
- 6.4.13 TRUMPF SE + Co. KG
- 6.4.14 Polatis Ltd. (Huber+Suhner AG)
- 6.4.15 Nokia Corporation
- 6.4.16 Rockley Photonics Holdings Ltd.
- 6.4.17 Lumibird SA
- 6.4.18 Acacia Communications Inc. (Cisco)
- 6.4.19 GlobalFoundries Inc.
- 6.4.20 Analog Photonics LLC
7 MARKET OPPORTUNITIES AND FUTURE OUTLOOK
- 7.1 White-space and Unmet-Need Assessment

