
PUBLISHER: Mordor Intelligence | PRODUCT CODE: 1940802

PUBLISHER: Mordor Intelligence | PRODUCT CODE: 1940802
United States (US) Point Of Sale (POS) Terminals - Market Share Analysis, Industry Trends & Statistics, Growth Forecasts (2026 - 2031)
The United States Point Of Sale Terminals market is expected to grow from USD 29.11 billion in 2025 to USD 31.68 billion in 2026 and is forecast to reach USD 48.4 billion by 2031 at 8.84% CAGR over 2026-2031.
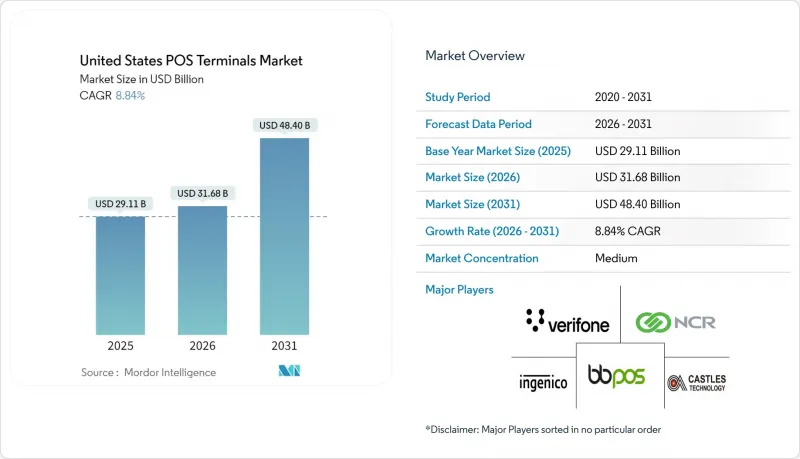
This growth is driven by accelerated EMV and NFC upgrades, rising contactless adoption, and the migration of small merchants to cloud-based mobile POS solutions. Regulatory triggers, including PCI DSS 4.0 mandates, are prompting hardware refresh cycles, while FedNow and other real-time rails are reshaping settlement expectations. Processor fee compression is intensifying vendor consolidation pressures as margins on standalone hardware narrow. Merchants also favor Android smart terminals that support semi-integrated architectures and embedded finance applications, enabling unified commerce analytics without breaching PCI scope.
United States (US) Point Of Sale (POS) Terminals Market Trends and Insights
Rapid EMV and NFC Terminal Upgrade Cycle
EMVCo recorded an 87% rise in U.S. contactless transactions during 2024, with tap-to-pay now accounting for 34% of all card-present activity. Liability shifts on non-EMV hardware elevate fraud risk, pushing merchants toward NFC-ready replacements. Contactless processing is 53% faster than chip insert, cutting wait times and limiting basket abandonment. Competitive pressure now compels even late-adopting small businesses to refresh terminals ahead of 2027 contract renewals.
SME Shift to Cloud-Based mPOS Solutions
Federal Reserve polling shows 67% of U.S. small firms prioritize integrated inventory and analytics within payment systems. Tablet-based mPOS reduces upfront hardware costs and lowers monthly processing fees by 23% versus legacy leases. Embedded finance bundles from Stripe and Square further compress adoption friction, helping pop-up retailers accept payments wherever connectivity exists.
Intensifying Cyber-Attack Sophistication on POS End-Points
FS-ISAC tracked a 34% rise in POS-targeted malware variants during 2024, including exploits on NFC channels and Android vulnerabilities. Merchants now budget for endpoint detection and encrypted communications that raise overall POS system costs 15-25%. Smaller operators, deterred by added complexity, postpone upgrades or revert to cash-only in high-risk settings.
Other drivers and restraints analyzed in the detailed report include:
- Retailer Demand for Unified Commerce Analytics
- PCI-DSS 4.0 Compliance Driving Hardware Refresh
- Inflation-Driven Cap-Ex Deferrals by Small Merchants
For complete list of drivers and restraints, kindly check the Table Of Contents.
Segment Analysis
Contactless solutions constitute the fastest-moving slice of the US POS terminals market at a 10.37% CAGR, although contact-based readers still held a 68.15% US POS terminals market share in 2025. Mastercard found tap-to-pay already represents 73% of face-to-face transactions globally, and U.S. usage climbed 87% year over year. Federal Reserve data shows consumer preference for contactless rose to 41% in 2024 from 23% in 2023, sustained by quicker throughput and hygiene benefits.
Merchants continue to support chip-and-PIN for large-ticket sales and older consumer cohorts, leveraging the installed base while gradually layering in NFC. Dual-interface devices accommodate evolving wallet habits as Apple Pay and Google Pay reach 67% penetration among under-35 smartphone owners. Vendors able to furnish seamless contact and contactless acceptance stand to capture the incremental US POS terminals market size expansion through 2031.
The United States Point of Sale Terminals Market Report is Segmented by Mode of Payment Acceptance (Contact-Based and Contactless), POS Type (Fixed Point-Of-Sale Systems, Mobile/Portable Point-Of-Sale Systems), End-User Industry (Retail, Hospitality, Healthcare, Transportation and Logistics, and More). The Market Forecasts are Provided in Terms of Value (USD).
List of Companies Covered in this Report:
- Verifone Systems Inc.
- Ingenico Inc.
- PAX Technology Limited
- Toshiba Global Commerce Solutions, Inc.
- NCR Corporation
- Diebold Nixdorf Incorporated
- Castles Technology Co., Ltd.
- BBPOS Limited
- Newland Payment Technology Co., Ltd.
- UIC Payworld Inc.
- Equinox Payments, LLC
- Clover Network, LLC
- Square Inc. (Block Inc.)
- Toast, Inc.
- Lightspeed Commerce Inc.
- Posiflex Technology, Inc.
- Epson America, Inc.
- Elo Touch Solutions, Inc.
- HP Inc. (Retail Solutions)
- Zebra Technologies Corporation
Additional Benefits:
- The market estimate (ME) sheet in Excel format
- 3 months of analyst support
TABLE OF CONTENTS
1 INTRODUCTION
- 1.1 Study Assumptions and Market Definition
- 1.2 Scope of the Study
2 RESEARCH METHODOLOGY
3 EXECUTIVE SUMMARY
4 MARKET LANDSCAPE
- 4.1 Market Overview
- 4.2 Impact of Macroeconomic Factors
- 4.3 Market Drivers
- 4.3.1 Rapid EMV and NFC Terminal Upgrade Cycle
- 4.3.2 SME Shift to Cloud-Based mPOS Solutions
- 4.3.3 Retailer Demand for Unified Commerce Analytics
- 4.3.4 PCI-DSS 4.0 Compliance Driving Hardware Refresh
- 4.3.5 Surge in Real-Time Payment and Wallet Acceptance at POS
- 4.3.6 Embedded-Finance ISVs Bundling Terminals with SaaS
- 4.4 Market Restraints
- 4.4.1 Intensifying Cyber-attack Sophistication on POS End-points
- 4.4.2 Inflation-Driven Cap-Ex Deferrals by Small Merchants
- 4.4.3 Processor and Gateway Fee Compression Squeezing Hardware Margins
- 4.4.4 Rural Connectivity Gaps Limiting Wireless POS Performance
- 4.5 Industry Value Chain Analysis
- 4.6 Regulatory Landscape
- 4.7 Technological Outlook
- 4.8 Porter's Five Forces Analysis
- 4.8.1 Bargaining Power of Buyers
- 4.8.2 Bargaining Power of Suppliers
- 4.8.3 Threat of New Entrants
- 4.8.4 Intensity of Competitive Rivalry
- 4.8.5 Threat of Substitutes
- 4.9 Assessment of Macroeconomic Factors on the Market
5 MARKET SIZE AND GROWTH FORECASTS (VALUE)
- 5.1 By Mode of Payment Acceptance
- 5.1.1 Contact-based
- 5.1.2 Contactless
- 5.2 By POS Type
- 5.2.1 Fixed Point-of-Sale Systems
- 5.2.2 Mobile / Portable Point-of-Sale Systems
- 5.3 By End-User Industry
- 5.3.1 Retail
- 5.3.2 Hospitality
- 5.3.3 Healthcare
- 5.3.4 Transportation and Logistics
- 5.3.5 Other End-User Industries
6 COMPETITIVE LANDSCAPE
- 6.1 Market Concentration
- 6.2 Strategic Moves
- 6.3 Market Share Analysis
- 6.4 Company Profiles (includes Global level Overview, Market level overview, Core Segments, Financials as available, Strategic Information, Market Rank/Share for key companies, Products and Services, and Recent Developments)
- 6.4.1 Verifone Systems Inc.
- 6.4.2 Ingenico Inc.
- 6.4.3 PAX Technology Limited
- 6.4.4 Toshiba Global Commerce Solutions, Inc.
- 6.4.5 NCR Corporation
- 6.4.6 Diebold Nixdorf Incorporated
- 6.4.7 Castles Technology Co., Ltd.
- 6.4.8 BBPOS Limited
- 6.4.9 Newland Payment Technology Co., Ltd.
- 6.4.10 UIC Payworld Inc.
- 6.4.11 Equinox Payments, LLC
- 6.4.12 Clover Network, LLC
- 6.4.13 Square Inc. (Block Inc.)
- 6.4.14 Toast, Inc.
- 6.4.15 Lightspeed Commerce Inc.
- 6.4.16 Posiflex Technology, Inc.
- 6.4.17 Epson America, Inc.
- 6.4.18 Elo Touch Solutions, Inc.
- 6.4.19 HP Inc. (Retail Solutions)
- 6.4.20 Zebra Technologies Corporation
7 MARKET OPPORTUNITIES AND FUTURE OUTLOOK
- 7.1 White-space and Unmet-Need Assessment

