
PUBLISHER: Mordor Intelligence | PRODUCT CODE: 2035004

PUBLISHER: Mordor Intelligence | PRODUCT CODE: 2035004
Operational Technology (OT) Security - Market Share Analysis, Industry Trends & Statistics, Growth Forecasts (2026 - 2031)
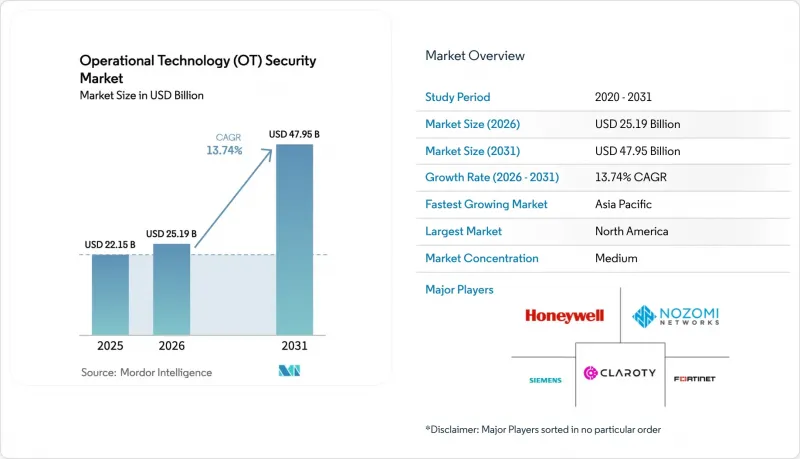
The operational technology security market size is expected to grow from USD 22.15 billion in 2025 to USD 25.19 billion in 2026 and is forecast to reach USD 47.95 billion by 2031 at 13.74% CAGR over 2026-2031.
Widespread digitalization of critical infrastructure exposed formerly isolated industrial control systems to internet-based threats, prompting urgent investment in layered cyber defense. Manufacturing accounted for 25.7% of reported industrial cyber incidents in 2023-2024, highlighting the sector's vulnerability to ransomware, wiper malware, and state-sponsored sabotage. Geopolitical tension compounded risk: state-aligned groups increased attacks on energy, transport, and water assets by 49% during 2024. Regulatory pressure accelerated spending; North American pipeline operators must now report incidents within 12 hours to CISA, driving uptake of continuous-monitoring platforms. Platform consolidation gained momentum because the EU NIS2 Directive requires "state-of-the-art" controls across supply chains, encouraging buyers to shift from point tools to integrated offerings. Simultaneously, the shortage of OT-specific cyber talent pushed many operators toward managed detection and response services that combine AI analytics with 24/7 incident handling.
Global Operational Technology (OT) Security Market Trends and Insights
Surge in Cyber-Attacks on Critical Infrastructure
Water utilities disclosed 400 exposed web interfaces in mid-2025, illustrating the scale of unsecured industrial assets. Sophisticated malware such as IOCONTROL targeted programmable logic controllers to enable covert manipulation of process variables. AI-driven anomaly-detection tools gained traction because rule-based systems struggled to recognize previously unseen behaviours. Beyond operational downtime, attacks produced cascading supply-chain disruption that affected adjacent sectors such as chemicals and transport.
Convergence of IT and OT Networks Expanding Attack Surface
Eighty percent of manufacturers experienced more security incidents after integrating enterprise IT resources with plant networks in 2024. Cloud analytics and predictive-maintenance workloads improved productivity but simultaneously exposed legacy protocols lacking authentication. Hybrid security operations centres that fuse IT and OT expertise became a strategic imperative, supported by network segmentation and asset-discovery engines that maintain real-time inventories of controllers, sensors, and gateways.
High Implementation and Lifecycle Cost of OT Security Platforms
Comprehensive OT security programs require multi-million-dollar outlays spanning hardware sensors, license fees, and multi-year maintenance contracts. Smaller electric utilities relied on the USD 250 million Rural and Municipal Advanced Cybersecurity Grant to offset adoption costs. Custom integration and prolonged factory-acceptance testing inflated the total cost of ownership, encouraging phased rollouts that can leave critical assets unprotected during transition.
Other drivers and restraints analyzed in the detailed report include:
- Stricter Global/Regional Regulations and Standards
- Rapid Industry 4.0 / IIoT Adoption in Process Industries
- Legacy System and Protocol Compatibility Limitations
For complete list of drivers and restraints, kindly check the Table Of Contents.
Segment Analysis
Solutions accounted for 62.34% revenue in 2025 because asset-discovery engines, intrusion-detection appliances, and segmentation gateways form the backbone of any operational technology security market program. However, services are rising at an 17.92% CAGR through 2031 as operators lean on managed detection, incident response, and compliance audits to offset the cyber-talent gap. Vendors now bundle outcome-based contracts that guarantee mean-time-to-detect thresholds and support around-the-clock SOC monitoring.
Industrial firms increasingly treat cyber resilience as an operational key-performance indicator rather than a capital project. Managed OT SOC offerings deliver scalable expertise without inflating headcount, while professional-services teams customize zero-trust architectures across heterogeneous controllers from Siemens, ABB, and Emerson. This shift underpins platform stickiness because continuous services embed vendor staff inside plants, discouraging technology swaps and stabilizing recurring revenue within the operational technology security market.
On-premises deployments dominated early rollouts due to latency sensitivities and data-sovereignty rules, capturing 70.42% share in 2025. Yet cloud-delivered analytics and configuration management are expanding at a 20.85% CAGR as hyperscalers achieve IEC 62443 and ISO 27001 certifications. Smaller manufacturers leverage consumption-based pricing to avoid capital expenditure while accessing advanced AI threat-correlation engines.
Hybrid architectures prevail, sensitive process variables remain inside the plant DMZ, whereas encrypted telemetry feeds behavioural indicators to cloud SOCs for long-term trending, threat-intelligence enrichment, and forensic search. As confidence grows, operators migrate historian backups, firmware repositories, and vulnerability-scanning workloads to the cloud, a trend expected to raise the operational technology security market size attributable to SaaS platforms.
Operational Technology (OT) Security Market is Segmented by Component (Solutions, and Services), Deployment Mode (On-Premise, and Cloud), End-User Industry (Manufacturing, Oil and Gas, Power Utilities, Transportation and Logistics, and More), Security Layer (Network Monitoring and Anomaly Detection, Endpoint/Device Security, and More), and Geography (North America, South America, Europe, Asia-Pacific, and Middle East and Africa).
Geography Analysis
North America retained leadership with 38.15% of 2025 revenue after headline attacks on pipelines, food processors, and local water districts drove bipartisan investment in critical-infrastructure defense. TSA directives obligate energy-pipeline operators to continuously monitor SCADA traffic and report anomalies within 12 hours. Canada invested in cybersecurity frameworks for hydroelectric dams, while Mexican automotive corridors boosted SOC outsourcing agreements.
Asia-Pacific delivered the highest growth trajectory, with the operational technology security market size expanding at a 19.75% CAGR between 2026-2031. China modernized its petrochemical and rail systems with 5 G-connected sensors, India mandated CERT-In incident reporting for power plants and smart-city projects, and Japan reinforced its nuclear-plant control systems against geopolitical disruption. ASEAN countries leveraged foreign direct investment to incorporate IEC 62443 assessments from project inception, sidestepping legacy-retrofit challenges.
Europe maintained steady momentum as the NIS2 Directive widened compliance scope to thousands of medium-sized industrial firms. Germany established state subsidies for SME machine-builders adopting secure-by-design PLCs, the UK's Critical National Infrastructure Centre published procurement checklists for secure remote-access gateways, and Italy accelerated renewables integration, demanding secure inverter telemetry. Eastern European utilities prioritized the segmentation of legacy substations, lifting regional demand within the operational technology security market.
- Fortinet, Inc.
- Nozomi Networks Inc.
- Claroty Ltd.
- Honeywell International Inc.
- Siemens Aktiengesellschaft (Siemens AG)
- Schneider Electric SE
- Rockwell Automation, Inc.
- GE Vernova LLC
- Darktrace Holdings Limited
- Palo Alto Networks, Inc.
- Cisco Systems, Inc.
- International Business Machines Corporation
- Dragos, Inc.
- Tenable, Inc.
- Armis Security Ltd.
- Forescout Technologies, Inc.
- Check Point Software Technologies Ltd.
- Microsoft Corporation
- Waterfall Security Solutions Ltd.
- OPSWAT, Inc.
- Radiflow Ltd.
- Indegy Ltd. (now part of Tenable, Inc.)
- BAE Systems plc
- Tripwire, Inc.
- AO Kaspersky Lab
Additional Benefits:
- The market estimate (ME) sheet in Excel format
- 3 months of analyst support
TABLE OF CONTENTS
1 INTRODUCTION
- 1.1 Study Assumptions and Market Definition
- 1.2 Scope of the Study
2 RESEARCH METHODOLOGY
3 EXECUTIVE SUMMARY
4 MARKET LANDSCAPE
- 4.1 Market Overview
- 4.2 Market Drivers
- 4.2.1 Surge in cyber-attacks on critical infrastructure
- 4.2.2 Convergence of IT and OT networks expanding attack surface
- 4.2.3 Stricter global/regional regulations and standards (e.g., NIS2, TSA SD02C)
- 4.2.4 Rapid Industry 4.0 / IIoT adoption in process industries
- 4.2.5 Insurance underwriting requirements linking premiums to OT-security posture
- 4.2.6 Emergence of plant-level zero-trust reference architectures
- 4.3 Market Restraints
- 4.3.1 High implementation and lifecycle cost of OT security platforms
- 4.3.2 Legacy system and protocol compatibility limitations
- 4.3.3 Budget deprioritisation at small / mid-size industrial sites
- 4.3.4 Shortage of OT-specific cyber-talent and field engineers
- 4.4 Value Chain Analysis
- 4.5 Regulatory Landscape (IEC 62443, NIS2, TSA, CISA, ISA/IEC-99)
- 4.6 Technological Outlook (AI-driven anomaly detection, 5G campus networks, TSN)
- 4.7 Porter's Five Forces Analysis
- 4.7.1 Threat of New Entrants
- 4.7.2 Bargaining Power of Buyers
- 4.7.3 Bargaining Power of Suppliers
- 4.7.4 Threat of Substitutes
- 4.7.5 Intensity of Competitive Rivalry
- 4.8 Macroeconomic Impact Assessment
5 MARKET SIZE AND GROWTH FORECASTS (VALUE)
- 5.1 By Component
- 5.1.1 Solutions
- 5.1.2 Services
- 5.2 By Deployment Mode
- 5.2.1 On-Premises
- 5.2.2 Cloud
- 5.3 By End-User Industry
- 5.3.1 Manufacturing
- 5.3.2 Oil and Gas
- 5.3.3 Power Utilities
- 5.3.4 Transportation and Logistics
- 5.3.5 Chemicals and Pharma
- 5.3.6 Mining and Metals
- 5.4 By Security Layer
- 5.4.1 Network Monitoring and Anomaly Detection
- 5.4.2 Endpoint / Device Security
- 5.4.3 Identity and Access Management
- 5.4.4 Secure Remote Access and Segmentation Gateways
- 5.4.5 Governance, Risk and Compliance Platforms
- 5.5 By Geography
- 5.5.1 North America
- 5.5.1.1 United States
- 5.5.1.2 Canada
- 5.5.1.3 Mexico
- 5.5.2 South America
- 5.5.2.1 Brazil
- 5.5.2.2 Argentina
- 5.5.2.3 Rest of South America
- 5.5.3 Europe
- 5.5.3.1 Germany
- 5.5.3.2 United Kingdom
- 5.5.3.3 France
- 5.5.3.4 Italy
- 5.5.3.5 Spain
- 5.5.3.6 Nordics
- 5.5.3.7 Benelux
- 5.5.3.8 Russia
- 5.5.3.9 Rest of Europe
- 5.5.4 Asia-Pacific
- 5.5.4.1 China
- 5.5.4.2 Japan
- 5.5.4.3 India
- 5.5.4.4 South Korea
- 5.5.4.5 ASEAN
- 5.5.4.6 Rest of Asia-Pacific
- 5.5.5 Middle East and Africa
- 5.5.5.1 Middle East
- 5.5.5.1.1 GCC
- 5.5.5.1.2 Turkey
- 5.5.5.1.3 Israel
- 5.5.5.1.4 Rest of Middle East
- 5.5.5.2 Africa
- 5.5.5.2.1 South Africa
- 5.5.5.2.2 Rest of Africa
- 5.5.5.1 Middle East
- 5.5.1 North America
6 COMPETITIVE LANDSCAPE
- 6.1 Market Concentration Analysis
- 6.2 Strategic Moves and Funding Landscape
- 6.3 Market Share Analysis
- 6.4 Company Profiles (includes Global-level Overview, Market-level Overview, Core Segments, Financials as available, Strategic Information, Market Rank/Share for key companies, Products and Services, and Recent Developments)
- 6.4.1 Fortinet, Inc.
- 6.4.2 Nozomi Networks Inc.
- 6.4.3 Claroty Ltd.
- 6.4.4 Honeywell International Inc.
- 6.4.5 Siemens Aktiengesellschaft (Siemens AG)
- 6.4.6 Schneider Electric SE
- 6.4.7 Rockwell Automation, Inc.
- 6.4.8 GE Vernova LLC
- 6.4.9 Darktrace Holdings Limited
- 6.4.10 Palo Alto Networks, Inc.
- 6.4.11 Cisco Systems, Inc.
- 6.4.12 International Business Machines Corporation
- 6.4.13 Dragos, Inc.
- 6.4.14 Tenable, Inc.
- 6.4.15 Armis Security Ltd.
- 6.4.16 Forescout Technologies, Inc.
- 6.4.17 Check Point Software Technologies Ltd.
- 6.4.18 Microsoft Corporation
- 6.4.19 Waterfall Security Solutions Ltd.
- 6.4.20 OPSWAT, Inc.
- 6.4.21 Radiflow Ltd.
- 6.4.22 Indegy Ltd. (now part of Tenable, Inc.)
- 6.4.23 BAE Systems plc
- 6.4.24 Tripwire, Inc.
- 6.4.25 AO Kaspersky Lab
7 MARKET OPPORTUNITIES AND FUTURE OUTLOOK
- 7.1 White-space and Unmet-need Assessment

