
PUBLISHER: Mordor Intelligence | PRODUCT CODE: 2035017

PUBLISHER: Mordor Intelligence | PRODUCT CODE: 2035017
Projector - Market Share Analysis, Industry Trends & Statistics, Growth Forecasts (2026 - 2031)
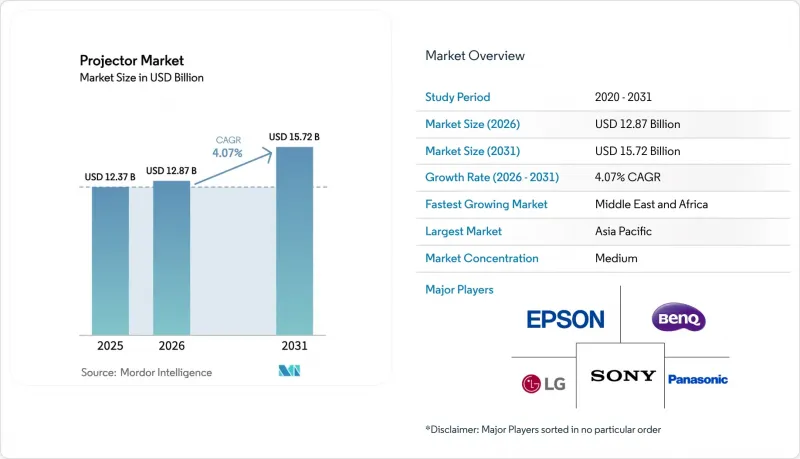
The Projector Market size was valued at USD 12.37 billion in 2025 and estimated to grow from USD 12.87 billion in 2026 to reach USD 15.72 billion by 2031, at a CAGR of 4.07% during the forecast period (2026-2031).
Solid-state illumination now sets the competitive tempo as regulatory bans on mercury lamps converge with corporate demand for low-maintenance devices. Asia-Pacific manufacturers leverage cost advantages and vertical supply chains, while European firms accelerate laser roll-outs to comply with the 2026 EU mandate. Government digital-classroom programs, the rise of ultra-short-throw solutions for hybrid offices, and immersive projection-mapping attractions continue to steer purchasing priorities. At the same time, large-format LED walls and DLP chipset shortages temper growth momentum.
Global Projector Market Trends and Insights
Government-funded smart-classroom roll-outs drive institutional demand
India's Rs 76,000 crore Semicon India programme, approved in April 2025, earmarks fiscal support for domestic display fabs that supply critical projector components. The United Arab Emirate's USD 2.7 billion digital-education budget in 2024 demonstrated how Gulf governments treat projection as core hybrid-learning infrastructure. These publicly funded procurements create predictable, multi-year refresh cycles that reward vendors able to satisfy local assembly clauses and warranty mandates. They also accelerate specification upgrades-interactive touch, wide-color-gamut laser, and network management-because institutions procure in bulk rather than piecemeal. Consequently, the projector market benefits from stable education demand even when corporate spending moderates.
Accelerating adoption of ultra-short-throw laser projectors for hybrid workplaces
Post-pandemic floor-plan reductions made long-throw installations unworkable, prompting facilities teams to embrace ultra-short-throw units that cast 100-inch images from under 30 cm. Sharp/NEC reports laser lifespans exceeding 20,000 hours, erasing lamp-replacement downtime and lowering service costs. Texas Instruments' DLPC8445 controller further tailors hardware to video-conferencing needs with 240 Hz frame rates and sub-millisecond latency. As enterprises upscale collaboration suites, willingness to pay a premium for space-efficient, maintenance-free projection strengthens the near-term growth outlook for the projector market.
Proliferation of large-format LED video walls cannibalising projector demand
Falling LED cost per pixel lures stadiums and convention centers toward seamless direct-view alternatives that outperform projection in uncontrolled lighting. Operators value the bezel-free visuals and 24/7 uptime, undermining renewal orders for 10,000-lumen projectors that once dominated these venues. As integrators standardize LED calibration software, the transition accelerates, shaving 1.1 percentage points from the projector market's forecast CAGR.
Other drivers and restraints analyzed in the detailed report include:
- Expansion of immersive projection-mapping attractions across Asian theme parks
- Rapid consumer shift to 4K/8K home-cinema projectors in China and South Korea
- Supply-chain shortages of DLP DMD chipsets creating production bottlenecks
For complete list of drivers and restraints, kindly check the Table Of Contents.
Segment Analysis
DLP technology secured 44.02% revenue share in 2025 owing to brightness efficiency and reliability in professional venues. Nevertheless, LED projectors post a 9.78% CAGR through 2031 as enterprises and educators pursue mercury-free compliance and 30,000-hour duty cycles. The projector market responds with slimmer chassis enabled by Texas Instruments' 90% size-reduced DLPC8445 driver that fits compact 4K housings.
LCD engines remain cost-efficient for sub-5,000-lumen classrooms, whereas LCOS entices premium home-cinema buyers chasing deep black levels. Vendors differentiate via proprietary color algorithms, edge-blending, and low-input-lag firmware, ensuring no single technology monopolizes upcoming bids. The resulting product stratification broadens the projector market's appeal across price tiers while sustaining competitive experimentation.
Lamp-based systems still accounted for the majority of shipments, yet the RGB pure-laser category is advancing at a 8.88% CAGR as theater chains and museums upgrade to wide-gamut output. The upcoming EU mercury ban has already triggered corporate purchasing moratoriums on replacement lamps, shifting tender specifications toward laser-phosphor modules that trim service calls. As a result, the projector market size tied to solid-state engines is climbing faster than total industry value.
LED hybrids dominate pico and ultra-portable models, where low heat and instant on/off outweigh absolute brightness. Across all tiers, steady lumen maintenance and 20,000-hour warranties attract finance teams seeking lower lifecycle cost, further compressing the addressable pool for lamp replacements.
The Projector Market Report is Segmented by Technology (DLP, LCD, LCOS, and More), Light Source (Lamp-Based, Laser Phosphor, and More), Resolution (WXGA, 1080p, and More), Brightness (ANSI Lumens) (Below 3, 000, 3, 000-5, 000, and More), Form Factor (Pico/Portable, Ultra-Short-Throw, and More), Application (Home Entertainment, Corporate/Business, and More), and Geography. The Market Forecasts are Provided in Terms of Value (USD).
Geography Analysis
Asia-Pacific led the projector market with 43.35% revenue share in 2025, powered by China's vast manufacturing cluster and South Korea's unusually high 20% household adoption rate. Brands such as XGIMI translated domestic volume into global competitiveness, booking CNY 3.39 billion (USD 467 million) by integrating IMAX and DTS certifications. Japan kept a technology edge through Epson's 50-year legacy, while India's semiconductor subsidies extend upstream gains to optical component fabs.
North America features regulatory stability that lets buyers continue lamp sourcing until asset depreciation ends, yet corporations actively pivot toward ultra-short-throw laser units to maximize remodeled spaces. United States integrators prize remote fleet-management firmware, and Canadian distributors market bilingual OS menus. Mexico's maquiladora corridor offers tariff-free assembly routes for brands addressing NAFTA content rules, ensuring the projector market remains regionally diversified.
Europe faces the sharpest disruption, as Regulation (EU) 2023/2049 eliminates mercury lamps from January 2026. Sony exited European projector sales in March 2025, paving the way for laser-centric competitors to gain shelf space. Germany and France channel partners are fast-tracking lamp stock clearance, while Nordic schools accelerate LED roll-outs to meet environmental procurement codes.
The Middle East and Africa is forecast to post a 5.08% CAGR through 2031, catalyzed by the UAE's USD 2.7 billion digital-education pledge. Saudi Arabia and Qatar replicate similar EdTech spending as part of Vision 2030 diversification agendas. South African universities adopt laser projectors to avoid frequent lamp imports, supporting regional aftermarket revenue.
South America remains the smallest slice but shows upside as Brazil's public-school modernization tenders stipulate interactive projection. Chile and Colombia convene tender rounds tied to telecom connectivity programs, promising incremental unit lift for value-priced LCD models. Political and currency risks keep vendors cautious, yet the projector market retains footholds via local distributors that bundle financing and maintenance.
- Epson Corporation
- BenQ Corporation
- Optoma Corporation
- Sony Corporation
- ViewSonic Corporation
- LG Electronics Inc.
- Panasonic Corporation
- Sharp NEC Display Solutions
- Christie Digital Systems
- Samsung Electronics Co., Ltd.
- Barco NV
- Canon Inc.
- Acer Inc.
- Hitachi Digital Media Group (Maxell Ltd.)
- VAVA (Shenzhen Sunvalley)
- JMGO (Holatek)
- XGIMI Technology Co. Ltd.
- Hisense Group
- Vivitek (Digital Projection/Delta Electronics)
- Casio Computer Co., Ltd.
- Ricoh Company, Ltd.
- Anker Innovations (Nebula)
- Xiaomi Corporation
- Dell Technologies Inc.
Additional Benefits:
- The market estimate (ME) sheet in Excel format
- 3 months of analyst support
TABLE OF CONTENTS
1 INTRODUCTION
- 1.1 Study Assumptions and Market Definition
- 1.2 Scope of the Study
2 RESEARCH METHODOLOGY
3 EXECUTIVE SUMMARY
4 MARKET LANDSCAPE
- 4.1 Market Overview
- 4.2 Market Drivers
- 4.2.1 Government-funded smart-classroom roll-outs in India, Gulf Cooperation Council Countries and ASEAN
- 4.2.2 Accelerating adoption of ultra-short-throw laser projectors for hybrid workplaces in North America and Europe
- 4.2.3 Expansion of immersive projection-mapping attractions across Asian theme-parks and live events
- 4.2.4 Rapid consumer shift to 4K/8K home-cinema projectors in China and South Korea
- 4.2.5 Integration of interactive touch and pen-enabled projection in K-12 replacing legacy white-boards
- 4.2.6 Lower TCO of solid-state (laser/LED) light-sources driving projector replacement cycles
- 4.3 Market Restraints
- 4.3.1 Proliferation of large-format LED video-walls cannibalising projector demand in large venues
- 4.3.2 Supply-chain shortages of DLP DMD chipsets creating production bottlenecks
- 4.3.3 Margin compression from aggressive ASP declines limiting vendor R&D budgets
- 4.3.4 EU RoHS mercury-lamp restrictions accelerating-but also disrupting-lamp-based projector sales
- 4.4 Industry Ecosystem Analysis
- 4.5 Technological Outlook
- 4.6 Porter's Five Forces Analysis
- 4.6.1 Threat of New Entrants
- 4.6.2 Bargaining Power of Buyers/Consumers
- 4.6.3 Bargaining Power of Suppliers
- 4.6.4 Threat of Substitute Products
- 4.6.5 Intensity of Competitive Rivalry
5 Market Size and Growth Forecastsv (Value)
- 5.1 By Technology
- 5.1.1 DLP
- 5.1.2 LCD
- 5.1.3 LCOS
- 5.1.4 LED
- 5.1.5 Laser/Hybrid
- 5.1.6 4K/8K Native Chipset
- 5.2 By Light Source
- 5.2.1 Lamp-based
- 5.2.2 Laser Phosphor
- 5.2.3 LED/Hybrid
- 5.2.4 RGB Pure-Laser
- 5.3 By Resolution
- 5.3.1 XGA and Below
- 5.3.2 WXGA
- 5.3.3 1080p
- 5.3.4 4K and Above
- 5.4 By Brightness (ANSI Lumens)
- 5.4.1 Below 3,000
- 5.4.2 3,000-5,000
- 5.4.3 5,001-10,000
- 5.4.4 Above 10,000
- 5.5 By Form Factor
- 5.5.1 Pico/Portable
- 5.5.2 Ultra-Short-Throw
- 5.5.3 Standard Throw
- 5.5.4 Installation/Large-Venue
- 5.6 By Application
- 5.6.1 Home Entertainment and Cinema
- 5.6.2 Corporate/Business
- 5.6.3 Education and Government
- 5.6.4 Rental and Staging/Large Venues
- 5.6.5 Simulation and Visualization
- 5.6.6 Others
- 5.7 By Geography
- 5.7.1 North America
- 5.7.1.1 United States
- 5.7.1.2 Canada
- 5.7.1.3 Mexico
- 5.7.2 Europe
- 5.7.2.1 Germany
- 5.7.2.2 United Kingdom
- 5.7.2.3 France
- 5.7.2.4 Nordics
- 5.7.2.5 Rest of Europe
- 5.7.3 South America
- 5.7.3.1 Brazil
- 5.7.3.2 Rest of South America
- 5.7.4 Asia-Pacific
- 5.7.4.1 China
- 5.7.4.2 Japan
- 5.7.4.3 India
- 5.7.4.4 South-East Asia
- 5.7.4.5 Rest of Asia-Pacific
- 5.7.5 Middle East and Africa
- 5.7.5.1 Middle East
- 5.7.5.1.1 Gulf Cooperation Council Countries
- 5.7.5.1.2 Turkey
- 5.7.5.1.3 Rest of Middle East
- 5.7.5.2 Africa
- 5.7.5.2.1 South Africa
- 5.7.5.2.2 Rest of Africa
- 5.7.5.1 Middle East
- 5.7.1 North America
6 COMPETITIVE LANDSCAPE
- 6.1 Market Concentration
- 6.2 Strategic Moves
- 6.3 Market Share Analysis
- 6.4 Company Profiles (includes Global level Overview, Market level overview, Core Segments, Financials as available, Strategic Information, Market Rank/Share for key companies, Products and Services, and Recent Developments)
- 6.4.1 Epson Corporation
- 6.4.2 BenQ Corporation
- 6.4.3 Optoma Corporation
- 6.4.4 Sony Corporation
- 6.4.5 ViewSonic Corporation
- 6.4.6 LG Electronics Inc.
- 6.4.7 Panasonic Corporation
- 6.4.8 Sharp NEC Display Solutions
- 6.4.9 Christie Digital Systems
- 6.4.10 Samsung Electronics Co., Ltd.
- 6.4.11 Barco NV
- 6.4.12 Canon Inc.
- 6.4.13 Acer Inc.
- 6.4.14 Hitachi Digital Media Group (Maxell Ltd.)
- 6.4.15 VAVA (Shenzhen Sunvalley)
- 6.4.16 JMGO (Holatek)
- 6.4.17 XGIMI Technology Co. Ltd.
- 6.4.18 Hisense Group
- 6.4.19 Vivitek (Digital Projection/Delta Electronics)
- 6.4.20 Casio Computer Co., Ltd.
- 6.4.21 Ricoh Company, Ltd.
- 6.4.22 Anker Innovations (Nebula)
- 6.4.23 Xiaomi Corporation
- 6.4.24 Dell Technologies Inc.
7 MARKET OPPORTUNITIES AND FUTURE OUTLOOK
- 7.1 White-space and Unmet-Need Assessment

